11.3 Natural Effects on Water Quality
In Section 11.1 we focused on the volume of water available, and argued that it is acceptable for water to be diverted from the water cycle for human use, as long as it does not adversely affect the rest of the hydrologic cycle. This makes for a potential water resource. For water to be useful, it must also be of suitable quality. There are a range of factors that affect the quality of potential water resources.
Fresh water on the surface (in streams or lakes) has limited opportunity to react with the surrounding materials, and so its natural chemical composition (excluding human-sourced contamination) is not typically a factor in terms of its quality. Groundwater, on the other hand, is in close contact with the rock or sediment through which it is moving and there is plenty of opportunity for the water chemistry to be changed by interaction with minerals. Groundwater can have specific natural chemical properties that make it suitable for some purposes. For example, many commercial spring water purveyors make (generally unsupported) claims that their water is healthier or tastes better than other water. On the other hand, groundwater can also have qualities that make it less than ideal, or even a risk to health. Concentrations of some of the common naturally occurring chemicals in water are summarized in this section.
Figure 11.3.1 shows the concentrations of the major constituents in groundwater from different parts of a sandstone aquifer on Vancouver Island and in surface waters from the same region. These values could be considered to be somewhat representative of aquifers in other locations, and certainly these seven constituents are the dominant components of most groundwaters. Bicarbonate, sodium and chloride are present at the highest concentrations in these waters—all between 70 and 120 mg/L—followed by sulphate and calcium at around 20 mg/L. If we were to add up all of these numbers the total would be close to 350 mg/L, which means that if we evaporated a litre of this water, we would be left with 0.35 g of salts, or a little less than 1/10th of a teaspoon. Water with over 1000 mg/L of dissolved solids is unlikely to be good to drink. Sea water has approximately 35,000 mg/L of dissolved solids (about 7 teaspoons), mostly as sodium and chloride.
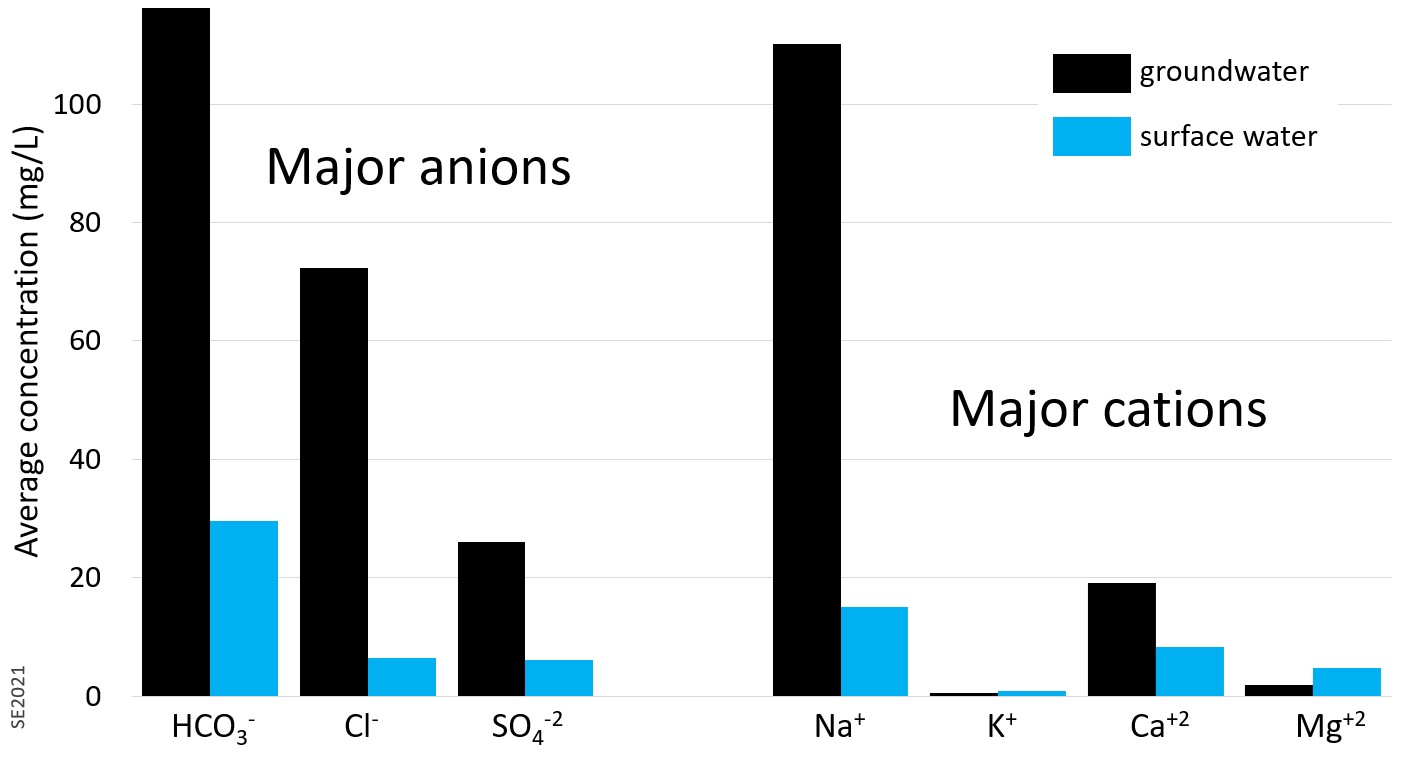
Concentrations in surface waters (streams and lakes) from the same areas of Vancouver Island are much lower (20% as high on average), although K and Mg are a little higher in the surface waters than the groundwaters. One litre of this water contains about 70 mg of the salts of these elements.
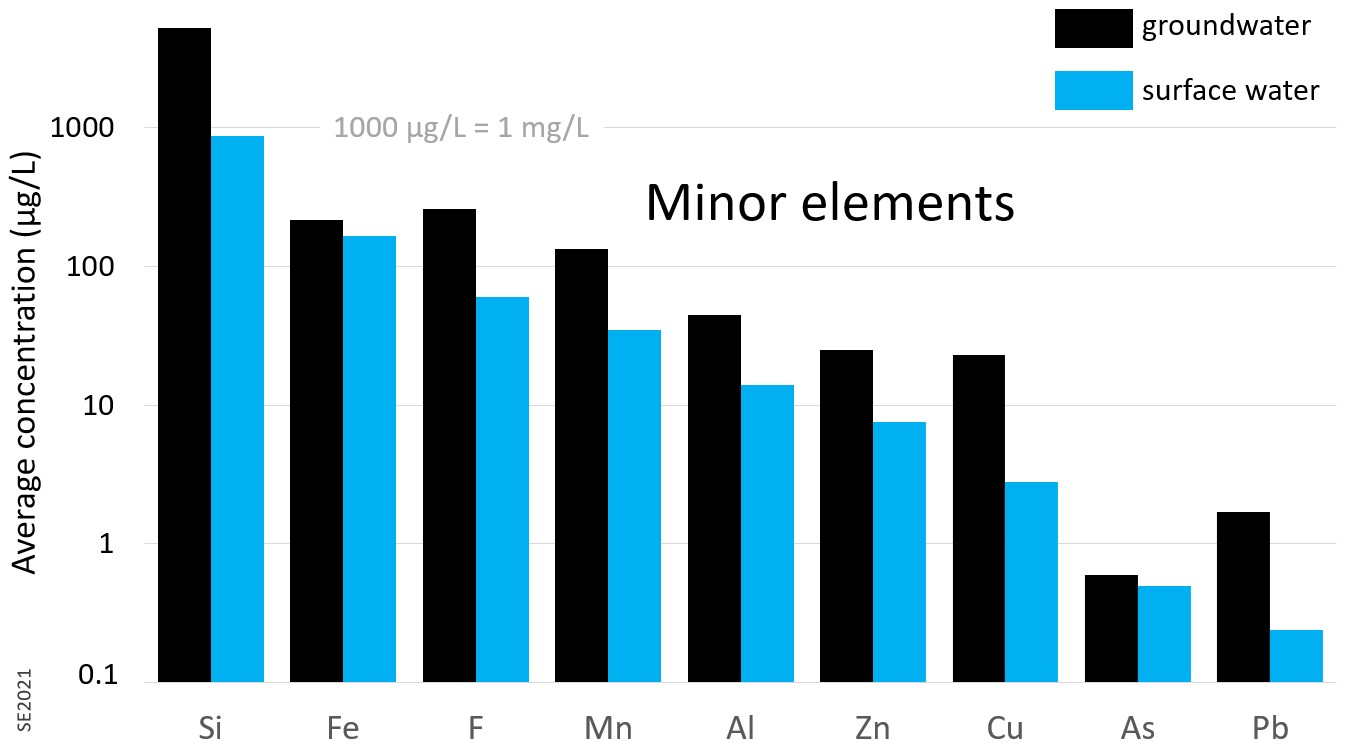
Concentrations of some of the important minor constituents in water samples from the same area are shown on Figure 11.3.2. The most abundant of these elements is silicon (Si), followed by iron (Fe) and fluoride (F). Note that this graph has a logarithmic scale; the average concentration of Fe is less than 1/10th that of Si, and Al is about 1/100th that of Si. The total contribution of all of these elements is equivalent to 6 mg in a litre of water.
pH
The hydrogen ion concentration of water is expressed in pH units. Most waters have pH within the range 6 to 8, where anything less than 7 is acidic. It is not uncommon for surface waters to have pH levels of less than 6, especially in areas where the water is draining over rock with even low levels of pyrite (FeS2). A low pH is not necessarily a concern in itself, but because most metals are more soluble at lower pH, acidic water tends to have higher concentrations of heavy metals such as copper and zinc (see Section 8.2). Acidic water can also be a problem in buildings because it will contribute to corrosion of metal pipes. It’s also quite common for surface water to have a pH well above 7, especially in areas underlain by limestone. Groundwater can also be acidic or basic (pH greater than 7). As discussed below in the section on fluoride, while a high pH is not typically a problem itself, it can be associated with other issues.
Hardness
One of the most common issues with groundwater is hardness, which is a measure of the combined concentrations of calcium and magnesium. Water is considered “hard” if it has hardness above 80 mg/L (Ca plus Mg expressed as CaCO3 equivalent) and this is common with waters that are derived from sandy aquifers or from limestone aquifers. Hard water inhibits the activity of soaps and detergents, so makes washing of clothes or dishes less effective than it is with soft water. Water softeners are widely used to treat hard water. These are effective in removing most of the Ca and Mg, but do so by replacing them with Na. Excess Na consumption is a health risk to many people, so drinking or cooking with softened water is not recommended.[1]
Box 11.2 Softening Water
The ions of different elements have different tendencies to be adsorbed or desorbed from substrates such as clay minerals*. The tendency for adsorption amongst the major cations in natural waters is as follows:
(strongly adsorbed) Ca > Mg > K > Na (weakly adsorbed).
This means that calcium ions are much more likely to be adsorbed onto surfaces than are sodium ions.
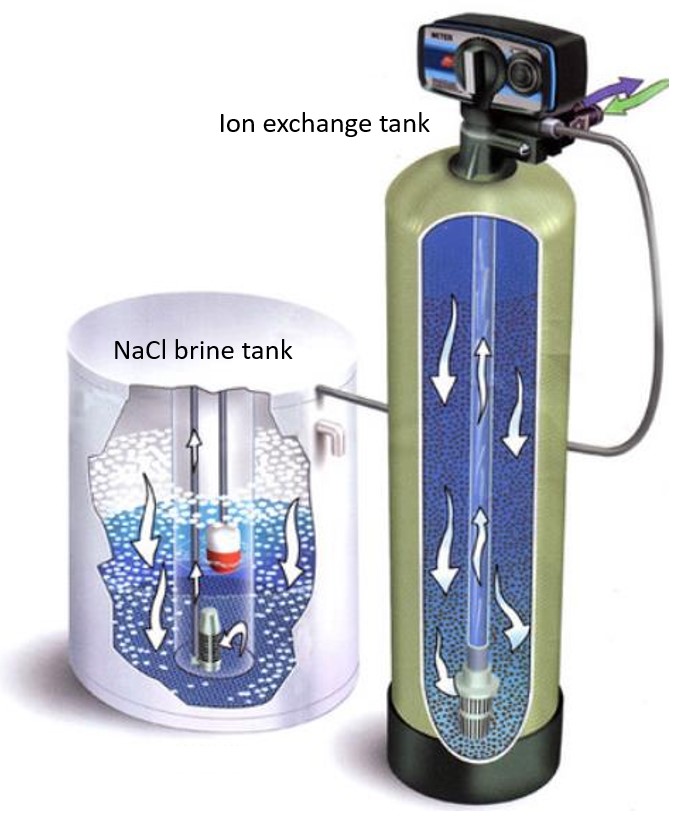
A water softener (Figure 11.3.3) takes advantage of this relationship. As the “hard” water is passed through the system calcium and magnesium ions in solution are preferentially adsorbed onto a substrate (an ion-exchange resin) and sodium ions are released into the water. After some time, most of the exchange sites are occupied by calcium and magnesium and the system ceases to function effectively. A sodium-chloride brine is periodically passed through the system, and because of the overwhelming amount of sodium in the solution, the calcium and magnesium ions on the exchange sites are replaced by sodium ions, thus “recharging” the ion exchange resin.
*Note that the word is adsorb not absorb. Adsorption means being attached onto a surface. Absorption means being incorporated into a solid. Water is absorbed into a sponge, but ions are adsorbed onto the surfaces of minerals.
Iron
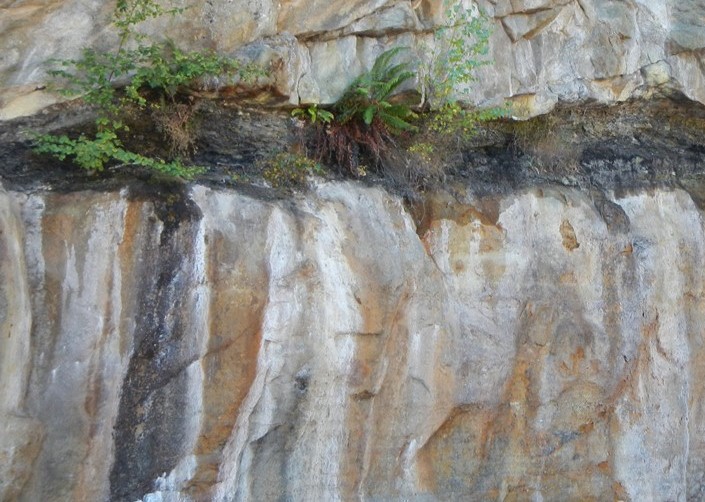
Like most other elements, iron can exist in more than one oxidation state; the two most common are Fe2+ (ferrous iron) and Fe3+ (ferric iron). The ferrous form predominates in situations where the oxidation potential is low and this is a characteristic of groundwater in many situations, especially where there is something like organic matter or iron-sulphide minerals that can use up the oxygen present in the water. Ferrous iron is quite soluble, while ferric iron is virtually insoluble, except at very low pH (which is typical of acid rock drainage, as described in Chapter 8). While the ground and surface waters shown on Figure 11.3.2 have iron concentrations of around 0.2 mg/L, ferrous iron is present at up to 10 mg/L in some deep groundwater.[2] When water of this type comes to surface the iron is quickly oxidized to the ferric state, and it precipitates as iron oxide and iron hydroxide minerals. An illustration of the effects this process is provided on Figure 11.3.3. Rusty stains like this are also common in kitchen and bathroom fixtures in places where the water source is anoxic and rich in iron.
Fluoride
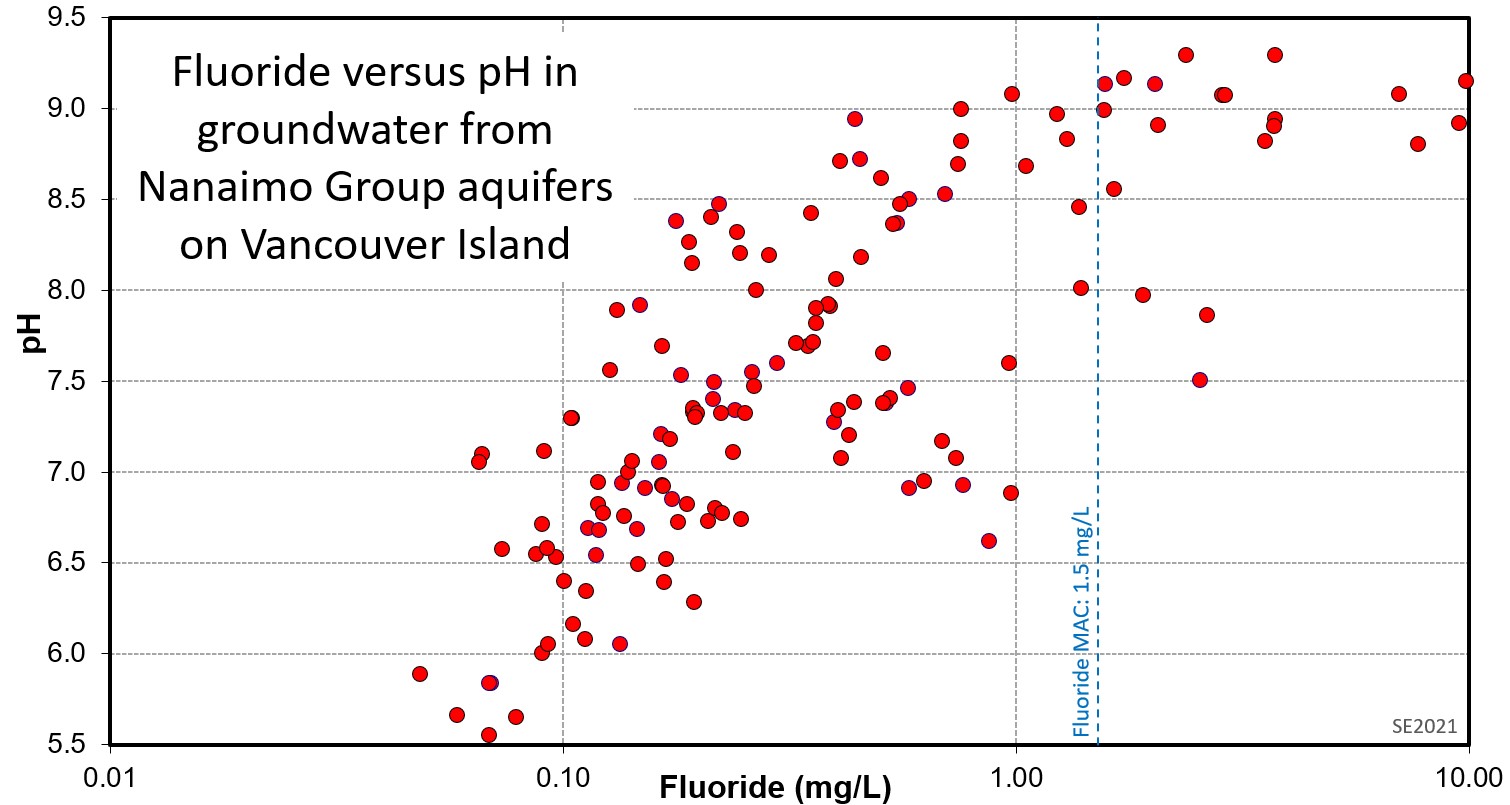
Fluoride is beneficial for dental health at low levels, but too much fluoride can lead to discolouration and malformation of teeth, and excessive fluoride over decades can lead to crippling skeletal problems. Almost all surface water and most groundwater has less than 0.5 mg/L (<500 µg/L) fluoride, but some groundwater has over 1.5 mg/L, which is the international maximum acceptable concentration (MAC) for fluoride. Fluoride solubility is low in water that has significant calcium concentrations and relatively low pH.
If groundwater has an elevated fluoride level its not likely because the aquifer materials (rock or sediments) have particularly high fluoride levels. Instead, there are water-rock interactions that make fluoride more soluble than it is under normal conditions, allowing fluoride levels to become elevated, even where there is relatively little fluorine in the surrounding material. That process is called base-exchange softening, and it is similar to what happens inside a water softener.
Most sandy aquifers also include clay minerals and, as described in Chapter 10, clay minerals are effective at ion adsorption. When water flows through a sandstone aquifer that has abundant adsorbed sodium ions, the calcium ions in the water will replace the sodium on the clay-mineral adsorption sites (see Box 11.2 for an explanation in the context of a water softener). This leads to softening of the water (more dissolved Na, less dissolved Ca) and also to a higher pH. Fluoride is relatively soluble under those conditions, so fluoride levels increase.
An example of this relationship is shown on Figure 11.3.4. Water samples from this aquifer have pH ranging from 5.5 to nearly 9.5. At low pH the fluoride levels remain well below 1 mg/L. Water that has been affected by base-exchange softening—resulting in an increase in Na at the expense of Ca, and an increase in pH—has higher fluoride levels, in many cases higher than the fluoride maximum acceptable concentration (MAC) of 1.5 mg/L fluoride.
Arsenic
In most ground and surface waters arsenic (As) concentrations are typically below 5 µg/L, and so are below the international MAC of 10 µg/L, but in some situations arsenic levels can get much higher.
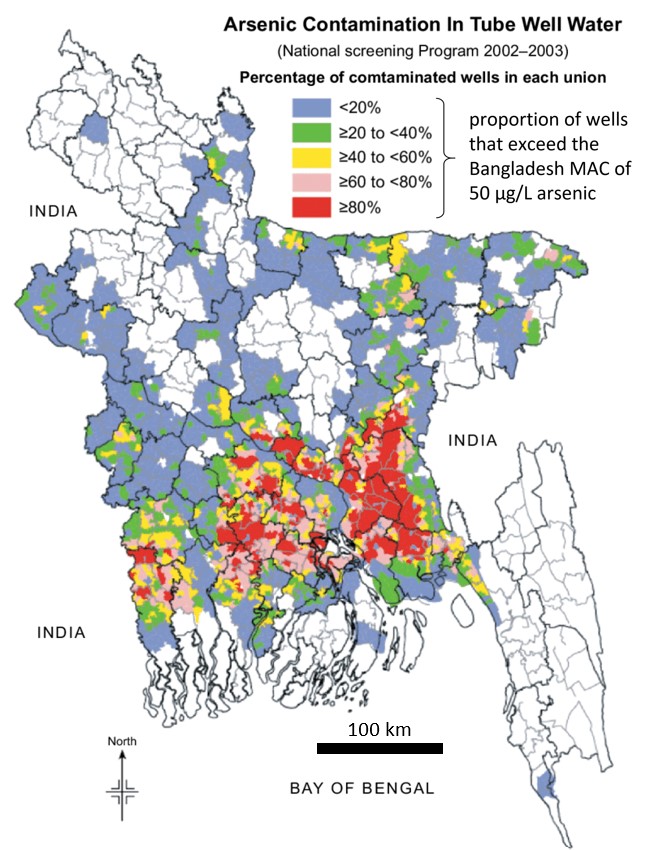
In the floodplain of the Ganges and Brahmaputra Rivers in Bangladesh over 100 million residents extract groundwater from small “tube wells” (wells with diameters of less than about 10 cm). About 8 million such wells were installed in Bangladesh between 1960 and 1990, many with assistance from UNICEF. Prior to that time most rural Bangladeshi’s relied on surface water sources, many of which were contaminated by bacteria and viruses. Gastrointestinal illnesses from these water sources were major health threats. The sediments surrounding groundwater wells are often sufficient to filter out many bacterial and viral contaminants, and thus provision of clean groundwater was celebrated as a major public health success.
However, in the mid 1990s it was discovered that many of the tube wells in Bangladesh have As levels above 50 μg/L (Figure 11.3.5), and as many as 20 million Bangladeshi’s are at risk of As poisoning (outcomes include cancer, diabetes, thickening of the skin, liver disease and digestive problems).
According to McArthur et al. (2001),[3] the high levels of As are directly related to the degree of oxidation of the water in the aquifer. Like iron, arsenic can have varying oxidation states, and as for iron, the less oxidized version, As3+, is much more soluble than the more oxidized version, As5+. Most of the tube wells in Bangladesh penetrate into ancient unconsolidated sand and gravel river sediments (dominated by quartz, feldspar and mica) that also include extensive peat layers. Oxygen is consumed as the organic matter in the peat reacts with groundwater. That generates the reducing conditions that result in the dissolution of the mineral limonite (FeOOH) to soluble ferrous iron (Fe2+), and release of the arsenic that was adsorbed onto the limonite. These same reducing conditions ensure that the arsenic remains in the more soluble arsenite (As3+) state, rather than the less soluble arsenate (As5+) state.
Saltwater Intrusion
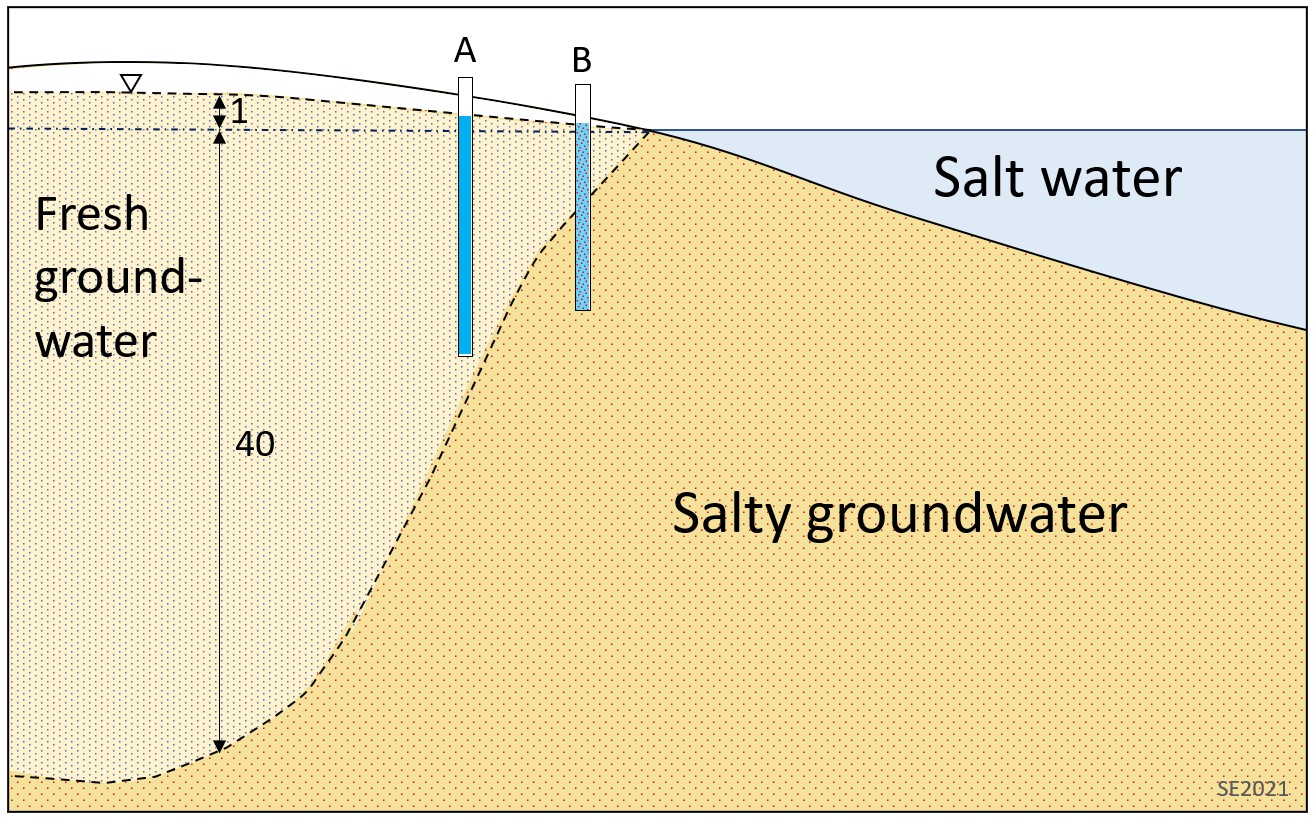
Many important aquifers are in coastal areas, but aquifers close to a coast are at risk from intrusion by salt water. As illustrated on Figure 11.3.6, groundwater beneath the ocean is salty, while that beneath the land is fresh. Because fresh water is less dense than salt water the fresh groundwater in near-shore areas exists in a lens that is approximately 40 times as deep as the height of the water table above the ocean surface. A well drilled within this lens (A) will produce fresh water, but one that penetrates into the salty groundwater (B) will produce salt water. In the scenario shown, well A is at risk of producing salt water if it is overused, as that will draw the water table down, and bring the fresh-salt interface up.
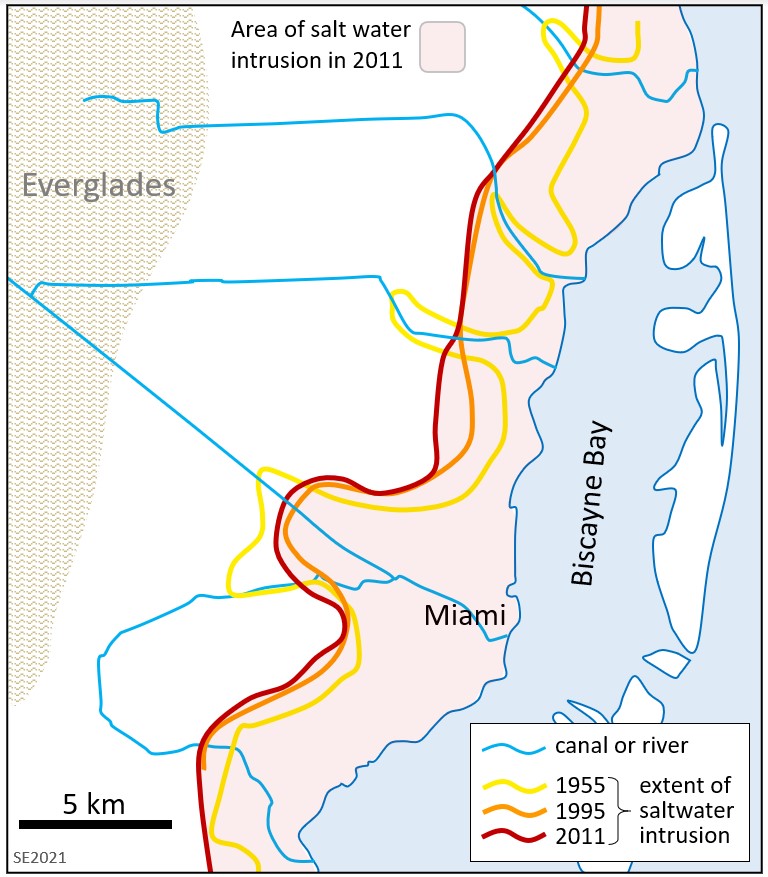
A significant salt water intrusion problem exists in the eastern part of Florida around Miami (Figure 11.3.7). The area is prone to intrusion for several reasons. First, it has very subdued topography; much of southern Florida is only a few metres above sea level. Second, the main near-surface aquifer in the region—the Biscayne Aquifer—includes limestone units with significant porosity and permeability related to dissolution that took place when the unit was above surface.[4] In addition to those natural factors, there are also several anthropogenic factors that contribute to salt intrusion. The region is densely populated and most of the public water supply is extracted from wells in the Biscayne Aquifer. Starting in the 19th century large areas of the nearby Everglade wetlands were drained to create land for agriculture and urban expansion. The consequent drop in the water level allowed sea water to flow inland. Furthermore, draining the wetlands was largely accomplished by building canals, and those canals have allowed sea water to extend well inland and then seep into the underlying aquifer.
The extent of salt water intrusion along Biscayne Bay is illustrated on Figure 11.3.7. As of 2011 about 1200 km2 were affected. Salt extended further inland in some areas in 1955—particularly along canals—but steps have been taken in recent decades to restrict the inland flow of salt water in the canals and so some of those areas have recovered.
Sea level rise resulting from climate change is going to exacerbate the salt water intrusion problem in southern Florida, and in many other low-relief coastal areas around the world. See Section 14.1 for more on that problem.
Turbidity
Turbidity is a measure of the amount of solid matter—clay and silt plus fine-grained organic matter—suspended in water. Turbid water may look cloudy, although at relatively low turbidity levels—which can still be dangerous—turbidity isn’t detectable without an instrument. Turbidity isn’t an issue because the suspended particles themselves are a health risk, but because they inhibit the effectiveness of disinfection processes. In turbid water biological pathogens attached onto clay mineral grains are effectively protected from chlorine or ozone disinfection, or they can literally be hidden from ultraviolet radiation.
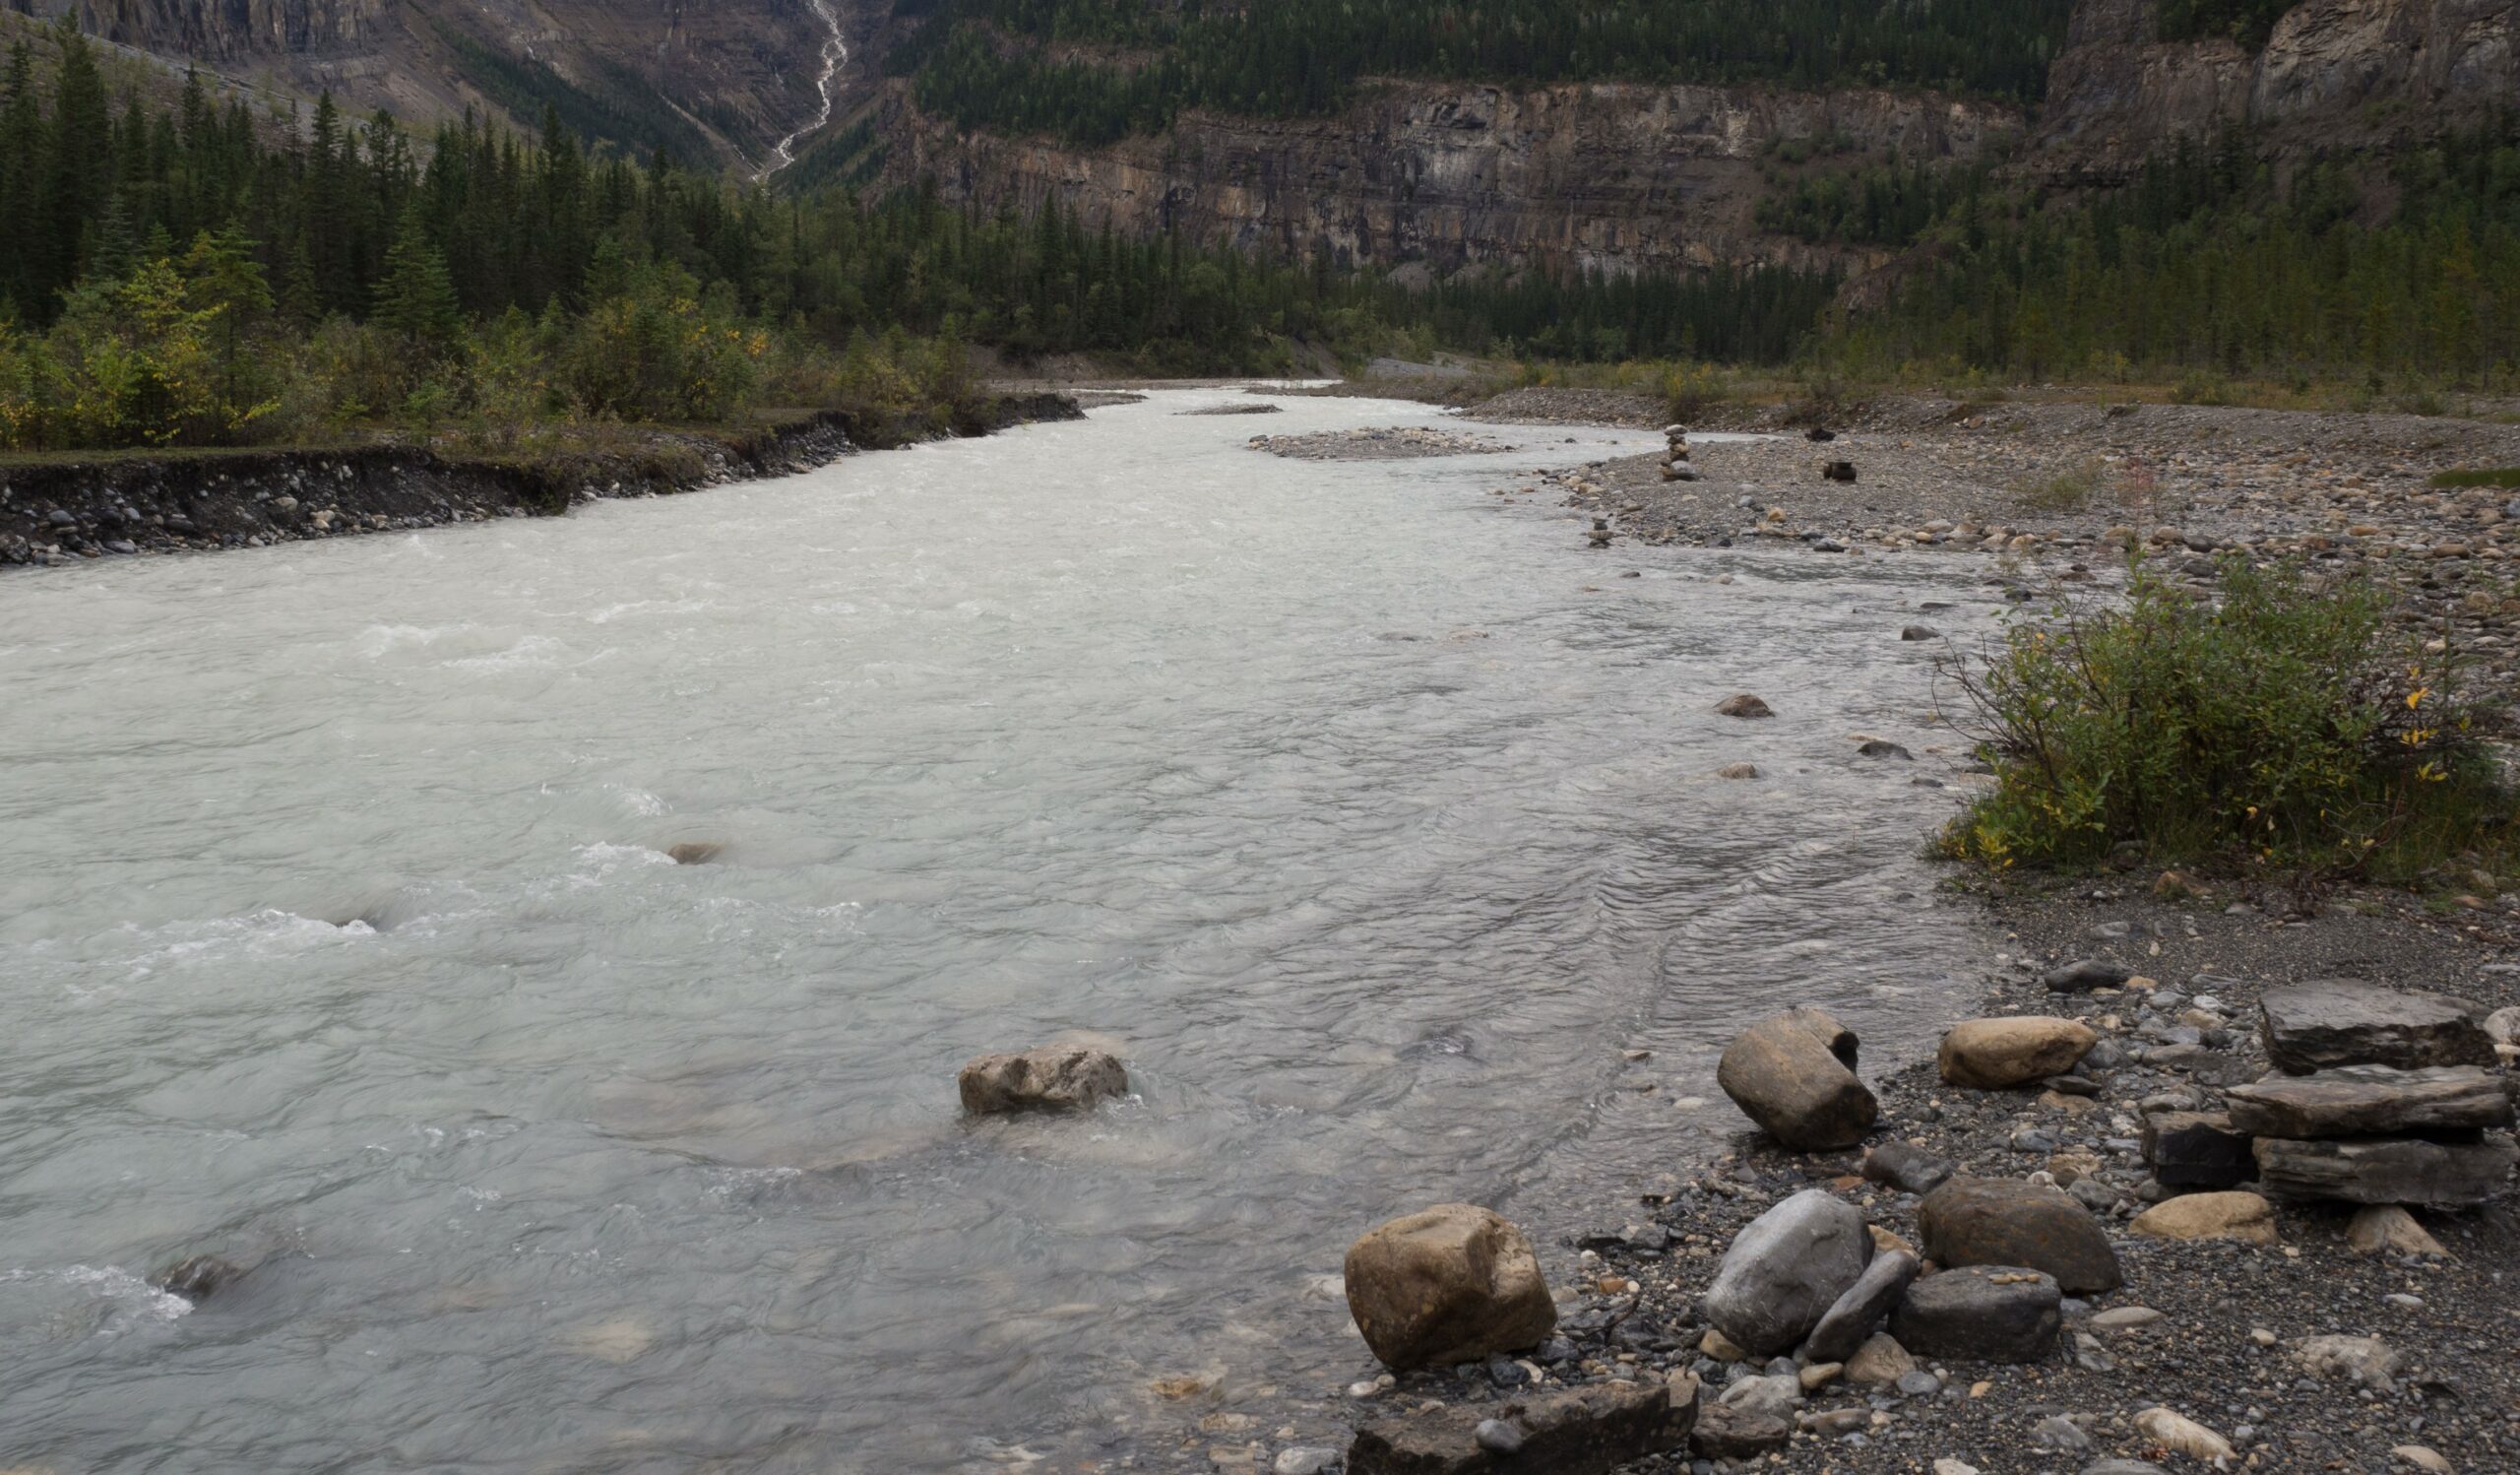
Groundwater is rarely turbid because of its inherent self-filtering by the aquifer, but surface water is often turbid, especially in regions with steep terrain (Figure 11.3.8) or following a storm or a debris flow. Most turbidity results from natural processes, but it can be exacerbated by human activities, especially farming, logging and construction.
Although it may not seem like a serious issue, elevated turbidity is one of the most common reasons for the declaration of boil-water advisories. Water suppliers that rely on surface water need to monitor turbidity carefully and continuously and to ensure that their filtration measures are effective. In order to avoid this problem, some water suppliers maintain a surface water supply for most of the year, but have backup groundwater wells that they can draw upon when the turbidity of the surface water is too high.
Exercise 11.2 What is a Turbidity Measurement?
Turbidity is typically determined using an instrument called a nephelometer (from the Greek word nephele, for cloud) which measures the amount of light that gets scattered (blocked) by particulate matter in a sample of the water. The more particulates in the water, the more the light gets scattered. The measurement is called an NTU, which stands for “nephelometric turbidity unit”.
The table below shows average turbidity of the North Saskatchewan River downstream from Edmonton. Although there is no standard factor for converting turbidity to total suspended solids (TSS)—as it varies from one water body to another—we can use the following relationship for this river: TSS (mg/L) = 3.4 * NTU. Calculate the average monthly TSS values for the North Saskatchewan at this location.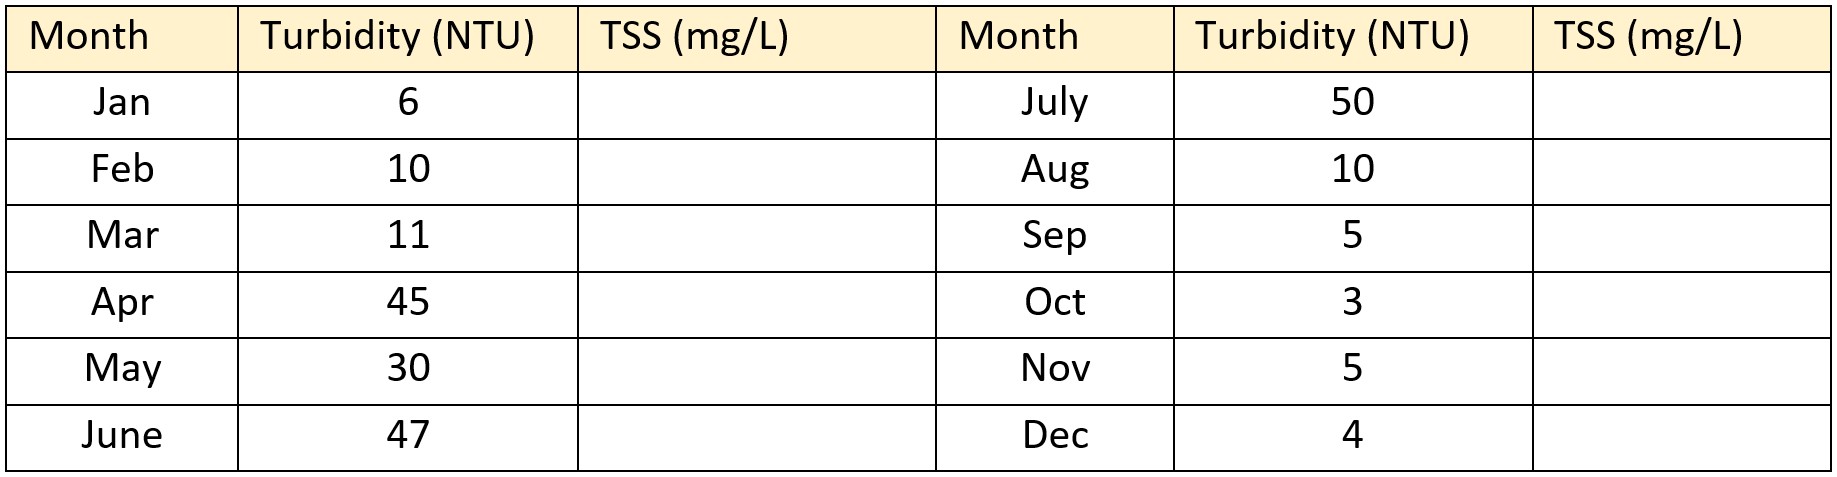
A significant part of the flow of this river is derived from snow melt in the Rockies. How does that help you explain the pattern of suspended sediment variations?
Coincidentally, there was a serious water-related health incident in the town of North Battleford, on the North Saskatchewan River a few hundred km downstream from the site used to create the data set above. In March and April of 2001, a device for removing particulates from the municipal water supply malfunctioned. This situation continued for several weeks (unknown to the operators) and because of the high turbidity, the disinfection system (chlorination) was unable to sufficiently reduce the level of the microorganism Cryptosporidium parvum from the water. Over 6000 residents became ill with gastroenteritis.[5]
Exercise answers are provided Appendix 2
Media Attributions
- Figure 11.3.1 Steven Earle, CC BY 4.0, based on data in Allen, D. and Suchy, M. (2001). Geochemical evolution of groundwater on Saturna Island, British Columbia. Canadian Journal of Earth Sciences, 38(7), 1059-1080. https://doi.org/10.1139/e01-007; and in Earle, S., Krogh, E. (2004) Groundwater geochemistry of Gabriola. Shale: Journal of the Gabriola, Historical & Museum Society, No. 7, 37-44. https://www.researchgate.net/publication/237654544_Geochemistry_of_Gabriola’s_groundwater
- Figure 11.3.2 Steven Earle, CC BY 4.0, based on data in Earle, S. and Krogh, E. (2004). Groundwater geochemistry of Gabriola. Shale, No. 7, 37-44. https://www.researchgate.net/publication/237654544_Geochemistry_of_Gabriola’s_groundwater
- Figure 11.3.3 How [a] Water Softener Works by Aqua mechanical, CC BY 2.0, via Flickr, https://www.flickr.com/photos/aquamech-utah/22391683206/
- Figure 11.3.4 Steven Earle, CC BY 4.0
- Figure 11.3.5 Steven Earle, CC BY 4.0, based on data in Earle, S. and Krogh, E. (2006). Elevated fluoride levels in a sandstone and mudstone aquifer system, eastern Vancouver Island, Canada. Proceedings of the Sea to Sky Geotechnique 2006 – the 59th Canadian Geotechnical Conference and the 7th Joint CGS/IAH-CNC Groundwater Specialty Conference, International Association of Hydrogeologists, 2006, 1584-1591. http://www.x-cd.com/SeatoSkyOnline/S4/0240-247.pdf
- Figure 11.3.6 Groundwater Arsenic Contamination in Bangladesh from Ahmad, S., Khan, M., Haque, M. (2018). Arsenic contamination in groundwater in Bangladesh: implications and challenges for healthcare policy. Risk Management and Healthcare Policy, 11, 251-261. https://doi.org/10.2147/RMHP.S153188. CC BY-NC 3.0)
- Figure 11.3.7 Steven Earle, CC BY 4.0
- Figure 11.3.8 Steven Earle, CC BY 4.0, based on information in Prinos et al. (2014)
- Figure 11.3.9 Steven Earle, CC BY 4.0
- Health Canada. (2019). Guidelines for Canadian drinking water quality—Summary table. Water and Air Quality Bureau, Healthy Environments and Consumer Safety Branch. https://www.canada.ca/content/dam/hc-sc/migration/hc-sc/ewh-semt/alt_formats/pdf/pubs/water-eau/sum_guide-res_recom/sum_guide-res_recom-eng.pdf ↵
- Hem, J. (1985). Study and interpretation of the chemical characteristics of natural water (3rd ed.). U. S. Geological Survey Water Supply Paper 2254. https://pubs.usgs.gov/wsp/wsp2254/pdf/wsp2254a.pdf ↵
- McArthur, J., Ravenscroft, P., Safiullah, S. and Thirlwall, M. (2001). Arsenic in groundwater: Testing pollution mechanisms for sedimentary aquifers in Bangladesh. Water Resources Research, 37(1), 109-117. https://doi.org/10.1029/2000WR900270 ↵
- Prinos, S., Wacker, M., Cunningham, K., and Fitterman, D. (2014). Origins and delineation of saltwater intrusion in the Biscayne aquifer and changes in the distribution of saltwater in Miami-Dade County, Florida: U.S. Geological Survey Scientific Investigations Report 2014–5025. http://dx.doi.org/10.3133/sir20145025 ↵
- Jameson, P., Hung, Y., Kuo, C.Y., & Bosela, P.A. (2008). Cryptosporidium outbreak (water treatment failure): North Battleford, Saskatchewan, Spring 2001. Journal of Performance of Constructed Facilities, 22, 342-347. https://doi.org/10.1061/(ASCE)0887-3828(2008)22:5(342) ↵