6.2 Earthquakes and Plate Tectonics
The distribution of earthquakes across the globe is shown on Figure 6.2.1. It is relatively easy to see the relationships between earthquakes and the plate boundaries. Along divergent boundaries like the mid-Atlantic ridge and the East Pacific rise earthquakes are common, but restricted to a narrow zone close to the ridge, and consistently less than 30 km depth (red dots). Shallow earthquakes are also common along transform faults, such as the San Andreas Fault. Earthquakes are very common along subduction zones, and their depth below surface increases inshore from the subduction zone (green and blue dots).
Earthquakes also occur in a few intraplate locations, including the Rift Valley area of Africa, in the Tibet region of China and in the Lake Baikal area of Russia.
Earthquakes at Divergent and Transform Boundaries
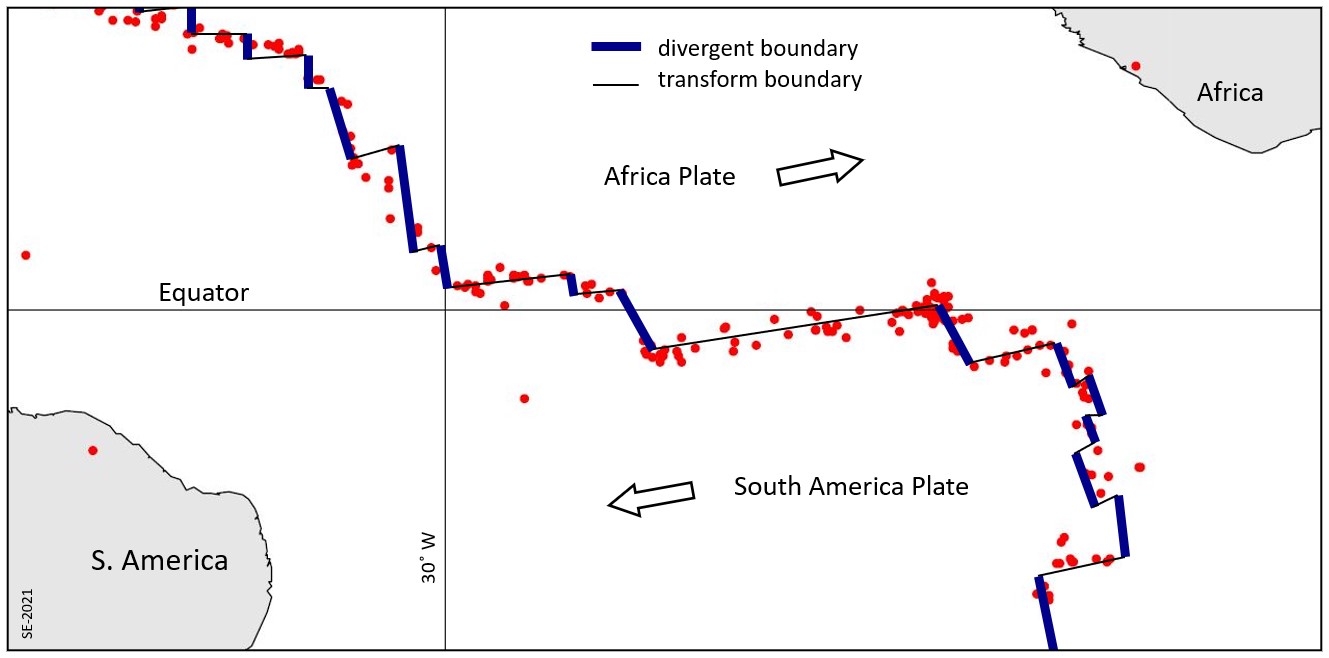
Figure 6.2.2 provides a closer look at magnitude 4 and larger earthquakes in an area of divergent and transform boundaries in the mid-Atlantic region near to the equator. Here the segments of the mid-Atlantic ridge (divergent boundaries) are offset by some long transform faults, and there is side-by-side motion on those faults. Most of the earthquakes are located along the transform faults, rather than along the divergent boundaries, although there are clusters of earthquakes at some of the divergent-transform intersections. Some earthquakes do occur on divergent boundaries, but they tend to be small and infrequent because of the relatively high rock temperatures in the areas where spreading is taking place.
Earthquakes at Convergent Boundaries
The distribution and depths of earthquakes in the Caribbean and Central America area are shown on Figure 6.2.3. In this region the Cocos Plate is subducting beneath the North America and Caribbean Plates (an ocean-continent convergence), and the South and North America Plates are subducting beneath the Caribbean Plate (an ocean-ocean convergence). In both cases the earthquakes get deeper with distance from the trench. The South America Plate is shown to be subducting beneath the Caribbean Plate in the area north of Columbia, but since there are almost no earthquake along this zone, it is questionable whether subduction is actually taking place.
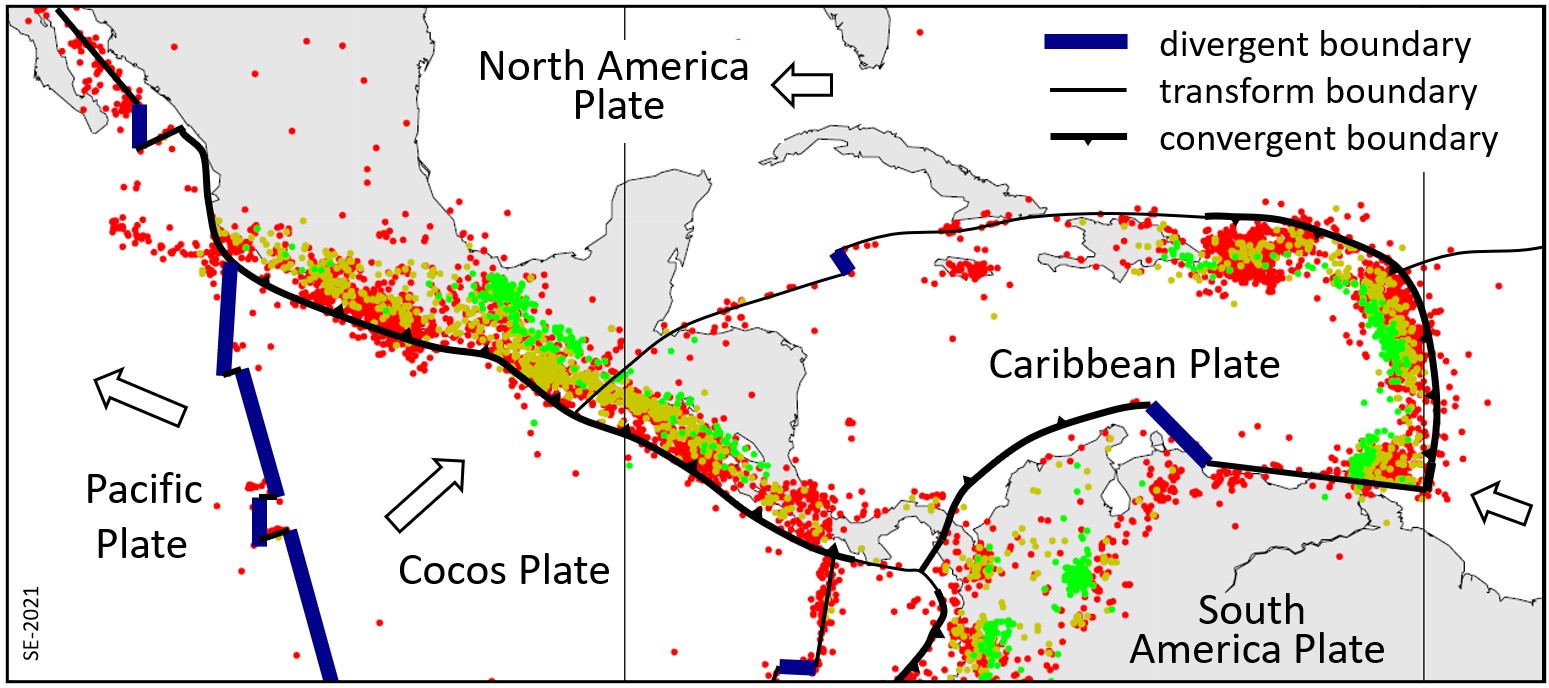

There are also various divergent and transform boundaries in the area shown on Figure 6.2.3, and, as in the mid-Atlantic area, most of the earthquakes are along the transform faults, and are relatively shallow.
The distribution of earthquakes with depth in the Kuril Islands area in the northwest Pacific is shown on Figure 6.2.4. This is an ocean-ocean convergent boundary. The small red and yellow dots show background seismicity over a number of years, while the larger white dots are individual shocks associated with a magnitude 6.9 earthquake in April 2009. The relatively large earthquake took place on the upper part of the plate boundary between 60 and 140 km inland from the trench. As we saw for the Cascadia subduction zone, this is where large subduction earthquakes are expected to occur.
In fact, all of the very large earthquakes—M9 or higher—take place at subduction boundaries because there is the potential for greater rupture zone width on a gently dipping subduction boundary than on a steep transform boundary. The largest earthquakes on transform boundaries are in the order of M8.
The background seismicity at this convergent boundary (Figure 6.2.4), and on other similar ones, is predominantly near to the upper side (crust side) of the subducting Pacific plate. The frequency of earthquakes is greatest near to surface and especially around the region of large subduction quakes (white dots), but it extends down to at least 400 km depth. There is also significant seismic activity in the over-riding North America plate, again most commonly near to region of large quakes, but also extending for a few hundred kilometres away from the plate boundary.
The distribution of earthquakes in the India-Asia area is shown on Figure 6.2.5. This is a continent-continent convergent boundary, and it is generally assumed that although the India Plate continues to move north towards the Asia plate, there is no actual subduction taking place. There are transform faults on either side of the India plate in this area.
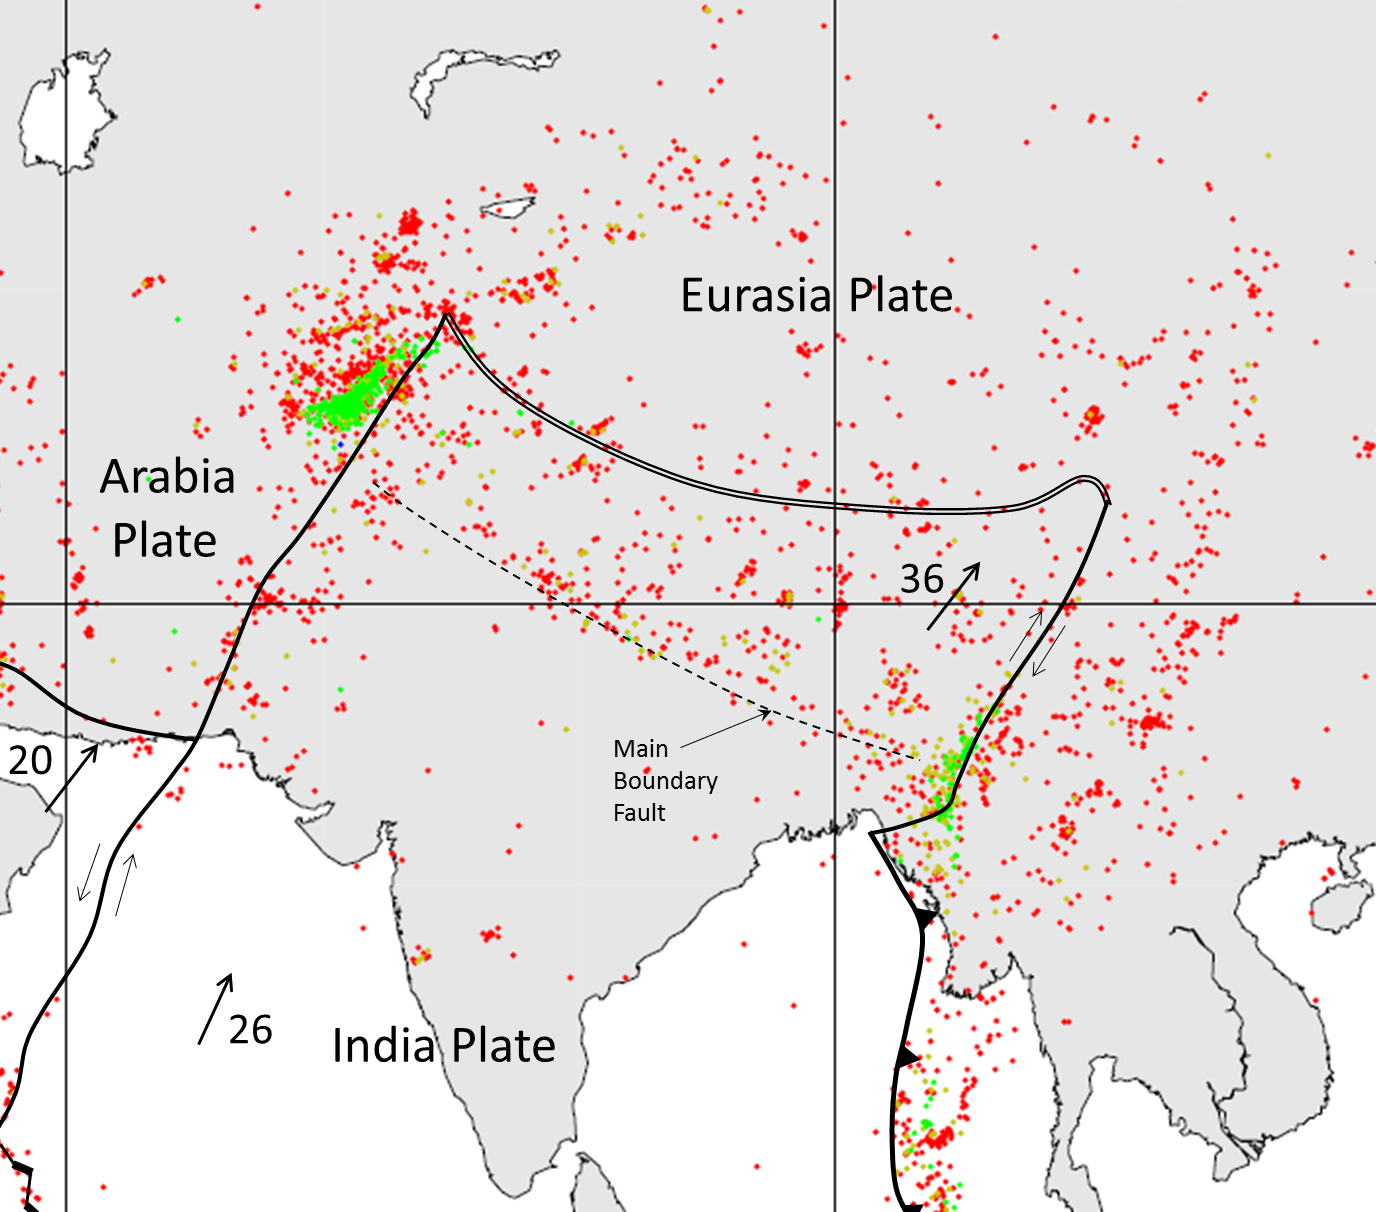
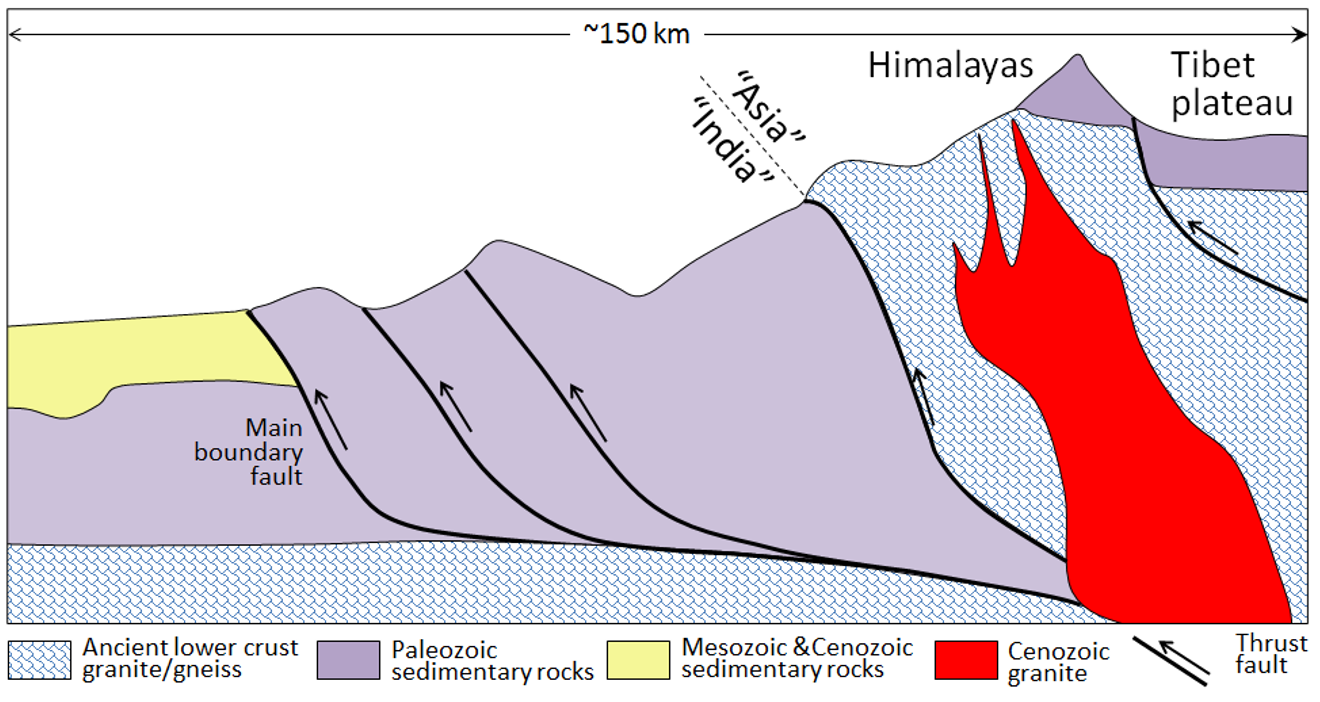
The entire northern India and southern Asia region is very seismically active. Earthquakes are common in northern India, Nepal, Bhutan, Bangladesh and adjacent parts of China, and throughout Pakistan and Afghanistan. Many of the earthquakes are related to the transform faults on either side of the India plate, and most of the others are related to the significant tectonic squeezing caused by the continued convergence of the India and Asia plates. That squeezing has caused the Asia plate to be thrust over top of the India plate, building the Himalayas and the Tibet Plateau to enormous heights. Most of the earthquakes of Figure 6.2.3 are related to the thrust faults shown on Figure 6.2.6 (and to hundreds of other similar ones that cannot be shown at this scale). The southernmost thrust fault on this diagram is equivalent to the Main Boundary Fault on Figure 6.2.4.
There is a very significant concentration of both shallow and deep (greater than 70 km) earthquakes in the northwestern part of Figure 6.2.5. This is northern Afghanistan, and at depths of more than 70 km, many of these earthquakes are within the mantle as opposed to the crust. It is interpreted that these deep earthquakes are caused by northwestward subduction of the India plate beneath the Asia plate in this area.
Intraplate earthquakes
Exercise 6.1 Earthquakes in Washington and British Columbia
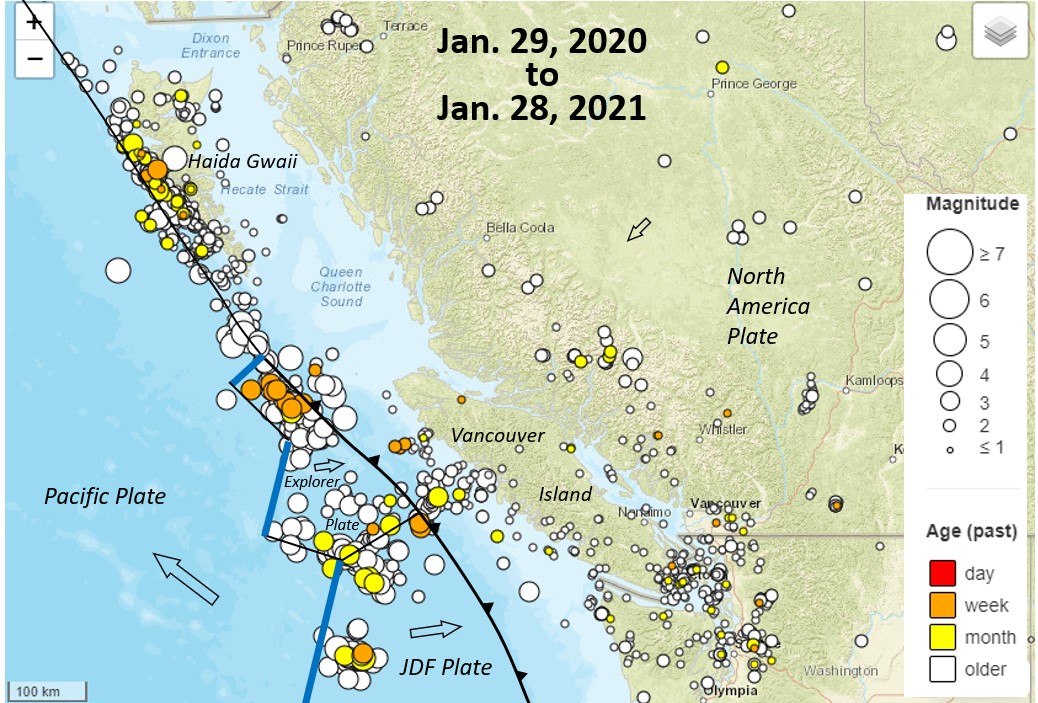
Figure 6.2.7 shows the incidence and magnitude of earthquakes in southwestern British Columbia and northwestern Washington over a one-year period from January 2020 to January 2021.
- What is the likely origin of the earthquakes between the JDF and Explorer plates?
- What is the sense of motion of the plate boundary that aligns with the string of earthquakes adjacent to Haida Gwaii.
- Most of the small earthquakes around Vancouver Island and south into northwest Washington are relatively shallow. What is their likely origin?
Exercise answers are provided Appendix 2
Media Attributions
- Figure 6.2.1 Dale Sawyer, Rice University, http://plateboundary.rice.edu Used with permission. All rights reserved.
- Figure 6.2.2 Dale Sawyer, Rice University. http://plateboundary.rice.edu. Used with permission. All rights reserved.
- Figure 6.2.3 Dale Sawyer, Rice University. http://plateboundary.rice.edu. Used with permission. All rights reserved.
- Figure 6.2.4 Steven Earle, CC BY 4.0, based on information in Hayes, G. P., Wald, D. J., and Johnson, R. L. (2012). Slab1.0: A three-dimensional model of global subduction zone geometries. Journal of Geophysical Research, 117, B01302. https://doi.org/10.1029/2011JB008524
- Figure 6.2.5 Dale Sawyer, Rice University. http://plateboundary.rice.edu. Used with permission. All rights reserved.
- Figure 6.2.6 Steven Earle, CC BY 4.0, based on a drawing by Vuichard, D. (n.d.). The Himalayan region: a geographical overview. In Ives, J. D. & Messerli, B. (Eds.), The Himalayan Dilemma. United Nations University. http://archive.unu.edu/unupress/unupbooks/80a02e/80A02E05.htm
- Figure 6.2.7 Steven Earle, CC BY 4.0, based on a Open Government Licence – Canada map by Natural Resources Canada at https://www.seismescanada.rncan.gc.ca/recent/maps-cartes/index-1y-en.php?tpl_region=west