13.1 Factors that Control Stream Discharge and Flooding
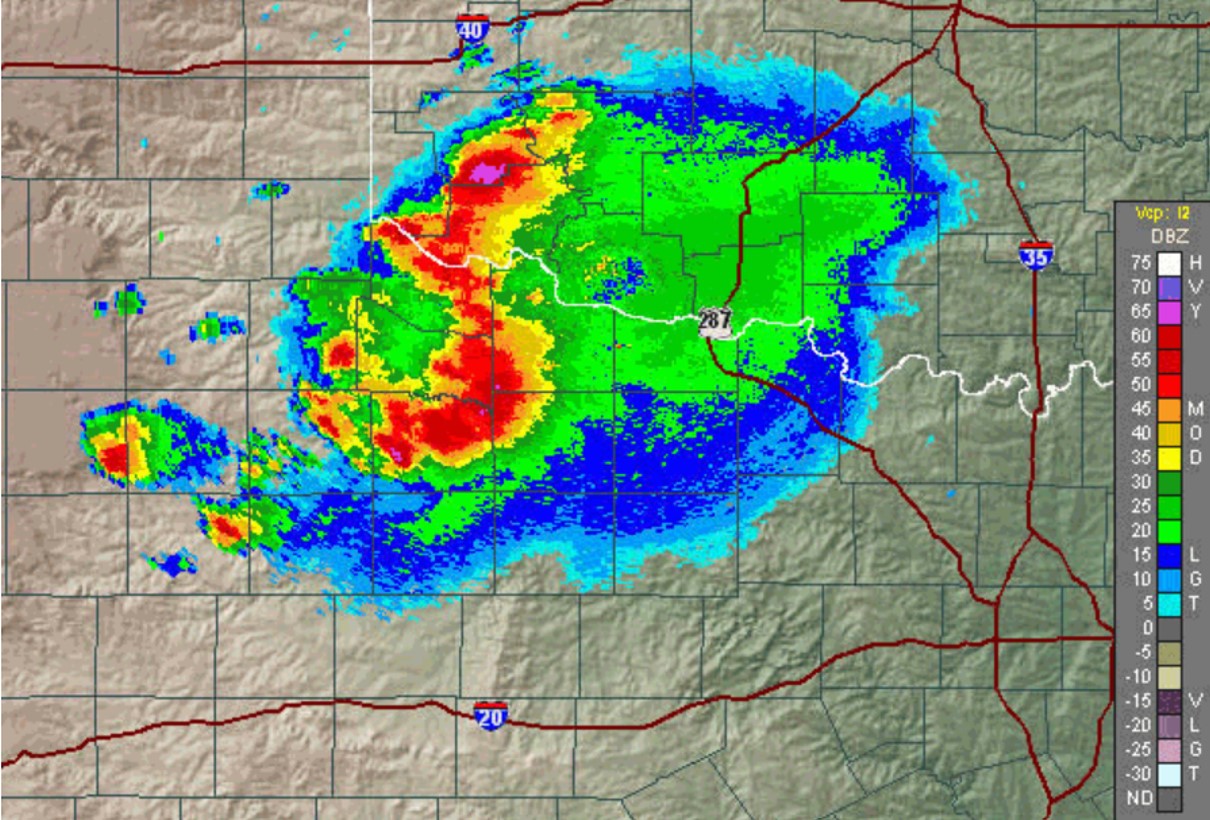
Floods happen because there is more water flowing in a stream than the normal channel can contain, but it’s not that simple. The most common cause of stream flooding is heavy precipitation, and an example of that is shown on Figure 13.1.1. This is a doppler radar image for an area southwest of Oklahoma City. It shows the degree of radar energy reflected from water droplets in the lower atmosphere. The small pink area may be experiencing rainfall rates of greater than 400 mm/h (which is very heavy rain), while the red areas may be experiencing > 40 mm/h of rain. Streams in that region would have responded with significant discharge rates, and there might have been some localized flooding.
Stream discharge rates can also increase dramatically as a result of the rapid melting of snow and even glacial ice. Rain can contribute to snow-melt, so in many cases flooding results from a combination of these two processes.
The water flowing in a stream and its tributaries comes from two main sources: overland flow (water flowing over the surface of the ground during and following heavy rain or very rapid snow melt), and discharge from groundwater (which is happening most of the time in many cases). Some of examples of variations in stream discharge rates (hydrographs) are provided on Figures 11.2.4, 11.2.5 and 11.2.7 and described in the accompanying text. A short interval from a hydrograph for the Little Qualicum River, on Vancouver Island, is shown on Figure 13.1.2. During the winters there is frequent heavy rain within most of the basin and frequent snow in the high-elevation parts. After a heavy rain event there will be overland flow for a short period, and the length of that period is proportional to the area of the drainage basin (which is 237 km2 in this case).[1] The typical duration of overland flow for a drainage basin of that size is estimated at about 2.5 days, although it would be shorter if a significant proportion of that precipitation fell as snow that did not melt quickly.

When there is heavy rainfall within a drainage basin some of the water can be expected to flow over the surface (for up to 2.5 days in the case of the Little Qualicum River), but most of it infiltrates into the ground to become groundwater. This raises the water table,[2] and therefore increases the rate of discharge into the stream. Those two main components contribute to a significant increase in the stream discharge that lasts for several days, and that discharge gradually decreases over time—rapidly at first as the overland flow rate slows, and slowly as the water table subsides and the rate of groundwater discharge into the stream decreases. During March and April 1986, the base flow of the Little Qualicum River (the flow level derived from groundwater discharge) increased because three major rainfall events added significantly to the groundwater storage. In late February the base flow was about 4.5 m3/s, and by late March (and also again in mid-April) it was 10.5 m3/s. By the end of the summer of that year, after several months with very little rain, the base flow had dropped to less than 1 m3/s.
Some of the spring and early summer discharge of the Little Qualicum River (and of most other streams in regions that get snow) is from snowmelt. If the snow melts slowly, over months, most of that water will reach the stream via groundwater. If it melts quickly, with a large pulse of snowmelt coming in just days, there might be some overland flow as well.
The Little Qualicum River didn’t flood in 1986, but it has flooded many times before then, and since, typically as a result of heavy rainfall from winter storms that originate in the Pacific Ocean to the west. Flooding on other streams also results from large storms, but in northern regions flooding from rapid snowmelt is quite common. In many cases, both types of events happen simultaneously. Flooding can also happen as a result of slope failure. If a stream channel is blocked because of slope failure the area upstream may flood, or if a significant amount of water accumulates behind a slope-failure dam, and then the dam fails, the area downstream may flood.
When a stream channel is filled with water to near its capacity, it is said to be at the “bank-full stage”. The water will be flowing rapidly with significant turbulence, and a high load of suspended clay, silt, sand and even granules (Figure 13.1.3). In the case of streams with wide flood plains the cross-sectional area available for flow will increase dramatically as soon as the stream overtops its bank and starts to flood, and even though there is more water moving than at bank-full stage, the velocity will decrease. As the velocity decreases some of the suspended sediments will be deposited. The coarser material will be deposited close to the normal bank top, forming a natural levee. Finer sediments will be deposited slowly, across the flood plain, over the days in which flood waters remain there, and especially when the flow velocity drops even more.
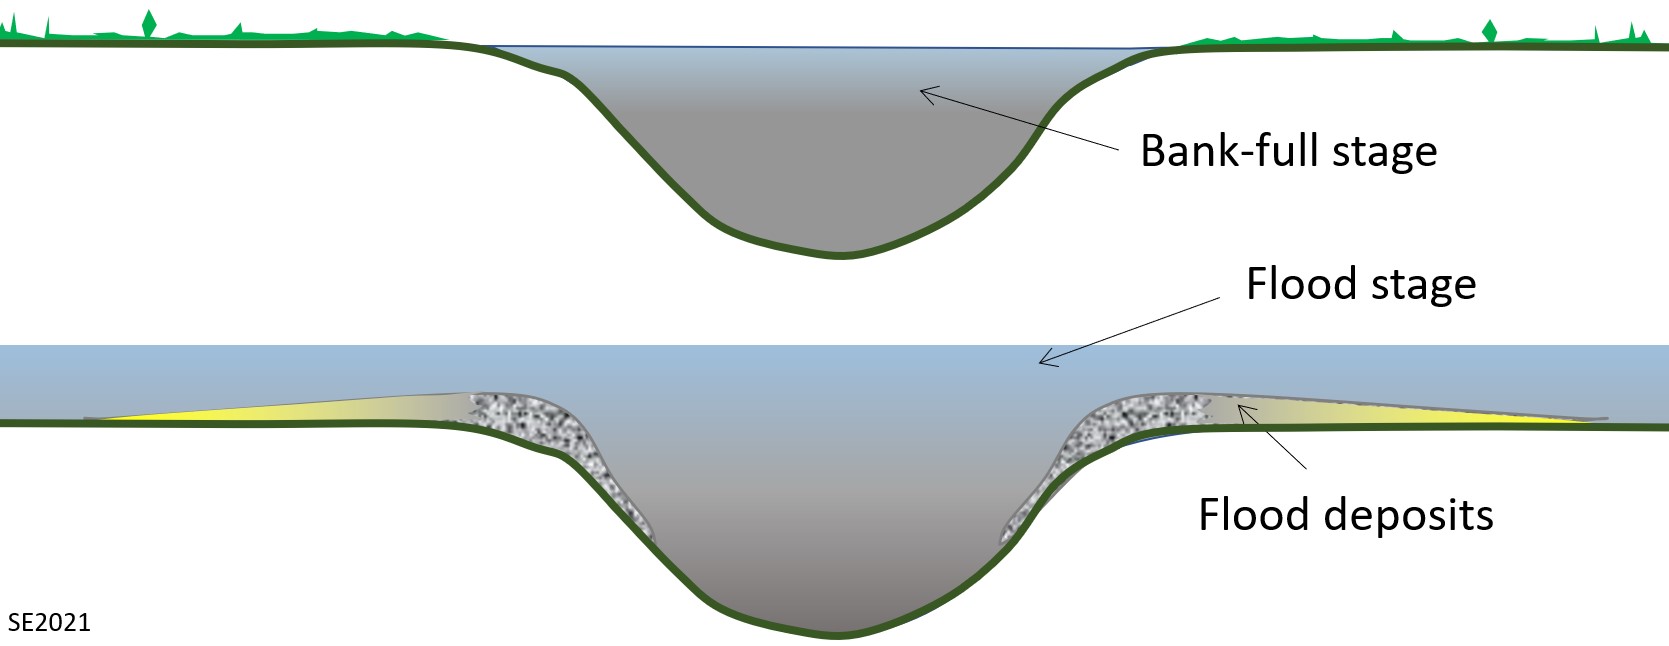
The natural levees formed by flooding can provide some protection against future flooding, but they can also prevent flood waters from flowing back into the stream, so prolonging the time over which some areas remain flooded.
Media Attributions
- Figure 13.1.1 Jet Stream, from the US National Weather Service, public domain, https://www.weather.gov/jetstream/refl
- Figure 13.1.2 Steven Earle, CC BY 4.0, based on public domain data at Water Survey of Canada, Environment Canada, https://wateroffice.ec.gc.ca/
- Figure 13.1.3 Steven Earle, CC BY 4.0
- The equation for estimating the duration of overland or surface flow is D = 0.827A0.2, where D is the number of days of overland flow and A is the area of the drainage basin (in km2). ↵
- For example, if there is 250 mm of rain and the porosity of the aquifer is 20%, the height of the water table should theoretically rise by 1250 mm. ↵