Appendix 2 Answers to exercises
1.1 Identifying Earth-system interactions
A few of the obvious ones include:
a) vegetation is growing with energy from the sun
b) vegetation is exchanging gases with the atmosphere
c) vegetation is using water (and nutrients dissolved in it) from the stream and from the ground
d) the stream is transporting water, dissolved constituents, and suspended materials to the ocean
e) there are weathering interactions taking place between the rocks and the stream water and between the rocks and the atmosphere
2.1 Cations, Anions and Ionic Bonding
- Lithium: 2 in first shell, 1 in the second (loses 1 electron and becomes a +1 cation)
- Magnesium: 2 in first, 8 in second, 2 in third (loses 2 electrons and becomes a +2 cation)
- Argon: 2 in first, 8 in second, 8 in third (doesn’t lose or gain any electrons, has 0 charge)
- Chlorine: 2 in first, 8 in second, 7 in third (gains 1 electron and becomes a -1 anion)
- Beryllium: 2 in first, 2 in second (loses 2 electrons and becomes a +2 cation)
- Oxygen: 2 in first, 6 in second (gains 2 electrons and becomes a -2 anion)
- Sodium: 2 in first, 8 in second, 1 in third (loses 1 electron and becomes a +1 cation)
2.2 Mineral Groups
- sphalerite: sulphide
- magnetite: oxide
- pyroxene: silicate
- siderite: carbonate
- sylvite: halide
- silver: native
- fluorite: halide
- feldspar: silicate
2.3 Rock Groups
1) metamorphic, foliated (regional), gneiss, formed from a sedimentary or igneous rock following deep burial
2) igneous, extrusive (volcanic), basalt, rapid cooling of mafic magma
3) igneous, intrusive, granite, slow colling of felsic magma
4) sedimentary, clastic, conglomerate, accumulation of sand and gravel, burial then lithification
2.4 Plate boundary processes
3.1 Visualizing continental Positions
There is no evidence that there has been a Rodinia-like concentration of continental mass around the equator during the Phanerozic (last 540 million years). Our understanding of continental positions earlier in the Precambrian than the Cryogenian is imperfect.
3.2 Volcanism and the Climate
There appears to have been a drop in global temperature of 0.1 to 0.2 degrees following the 1991 Pinatubo eruption. It lasted for about 2 years. There was a similar drop one year after the El Cichon eruption, but it isn’t actually clear that this is related to El Cichon because there was an immediate (~1 year) rise in temperature after that eruption. The global temperature record is quite noisy, so it is not obvious that either of these changes is actually a result of the volcanic eruption.
3.3 Ocean Water Densities
The following numbers are approximate. If your values are within 0.2 g/L of these values, then consider that close enough.
- North Carolina: 1025.9 g/L
- Newfoundland: 1026.6 g/L
- Iceland: 1027.1 g/L
- Svalbard: 1027.7 g/L
- Baja Sur: 1024.2 g/L
- Los Angeles: 1025.2 g/L
4.1 Pleistocene Glacials and Interglacials
During each glacial cycle there is a relatively gradual descent into cold conditions and then a much faster recovery to the warm conditions of the next interglacial. The previous four interglacials are as follows:
1) Approximately 120 ka
2) From about 200 ka to 240 ka
3) Approximately 330 ka
4) Approximately 405 ka
4.2 Moving ice
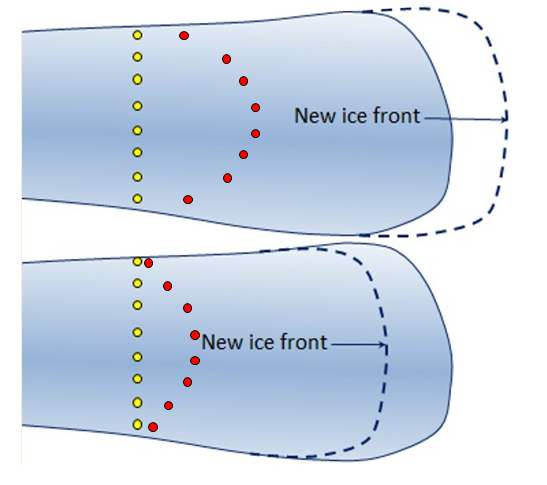
In the upper scenario the ice front has advanced. As shown by the red markers, the ice has moved forward even more than it has advanced because there has also been some melting at the front.
In the lower scenario the ice front has receded. As shown by the red markers, the ice has moved forward even a short distance, but because the extent of melting at the front has exceeded the extent of ice advance, the front of the glacier has receded.
4.3 Identify Glacial Erosion Features
a: col, b: arete, c: horn, d: cirque, e: truncated spur
4.4 Identify Glacial Depositional Environments
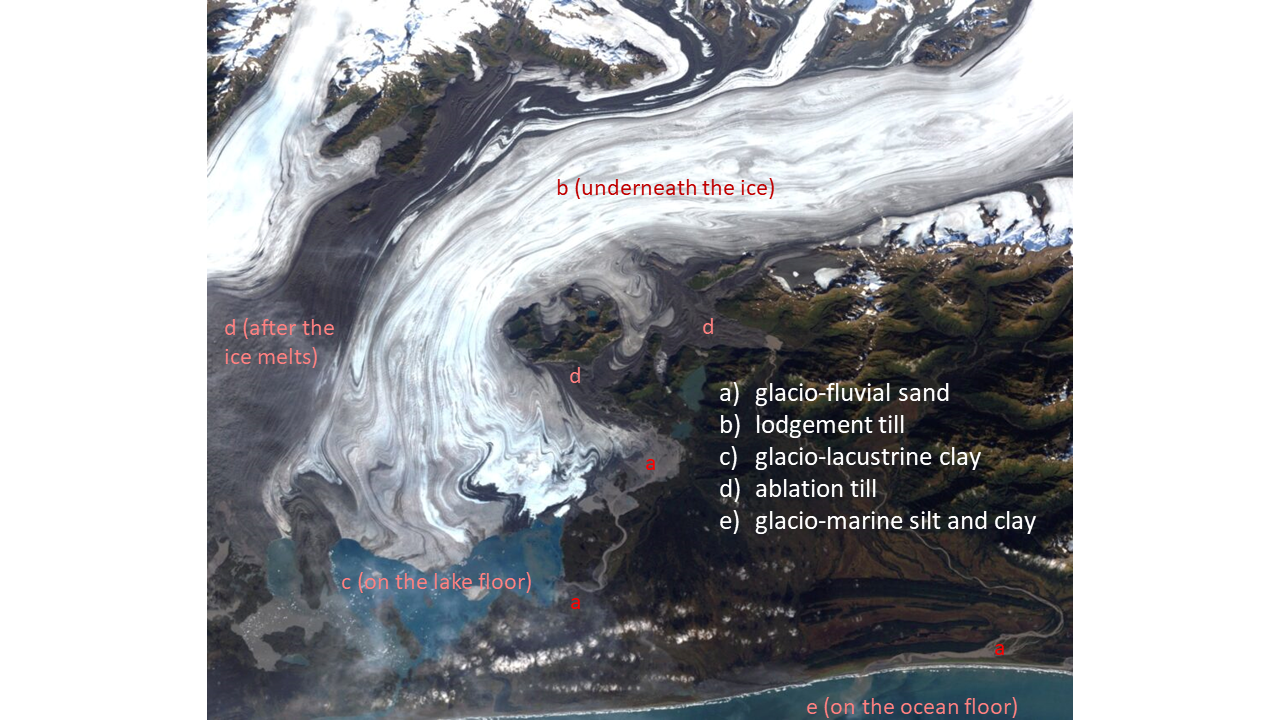
Some examples of where these types of sediments may be found (now or in the future) are shown. There are other places as well.
5.1 Sand and Water
Responses will vary.
5.2 Classifying Slope Failures
- a) slump south of San Jose, California
- b) debris flow on Vancouver Island, BC
- c) rock fall near to Keremeos, BC
- d) head scarp of a slump north of Parkfield, California
5.3 How Much Does a House Weigh?
The material excavated to build the house weighs about 264 T, compared with the house which weighs about 145 T. So, in this case, the construction of the house resulted in less weight on the ground at that location.
6.1 Earthquakes in Washington and British Columbia
1) The JDF and Explorer Plates appear to be moving at different rates towards the N. America Plate, therefore there is relative motion along their boundary. It is a transform fault.
2) The earthquakes to the west of Haida Gwaii are associated with the Queen Charlotte Fault, which is a transform plate boundary. The Pacific Plate is moving northwest with respect to the N. America Plate.
3) It is likely that these earthquakes are taking place within the crust of the N America Plate and are a result of deformation of the plate because it is locked against the subducting JDF Plate.
6.2 Moment Magnitude Estimates from Earthquake Parameters
- a) 7.3, b) 4.0, c) 6.8, d) 9.0, e) 7.0
For the 1969 Loma Prieta earthquake, if we use a length of 45 km and a width of 18 km, a displacement of 1.1 m would give us a magnitude of 6.9.
6.3 Estimating Intensity from Personal Observations
The following are intensity estimates based on the eight observations: III, IV, III, IV, III, III, III, IV. If your estimates were within one unit of these estimates that’s close enough, unless you were consistently higher or consistently lower. If your estimates are two or more units different from these, then please have another look.
6.4 Creating Liquefaction and Discovering the Harmonic Frequency
Results will vary.
7.1 How Thick is the Oceanic Crust?
It should be 10% of the thickness of the melt zone, so about 6 km.
7.2 Under Pressure!
Answers will vary.
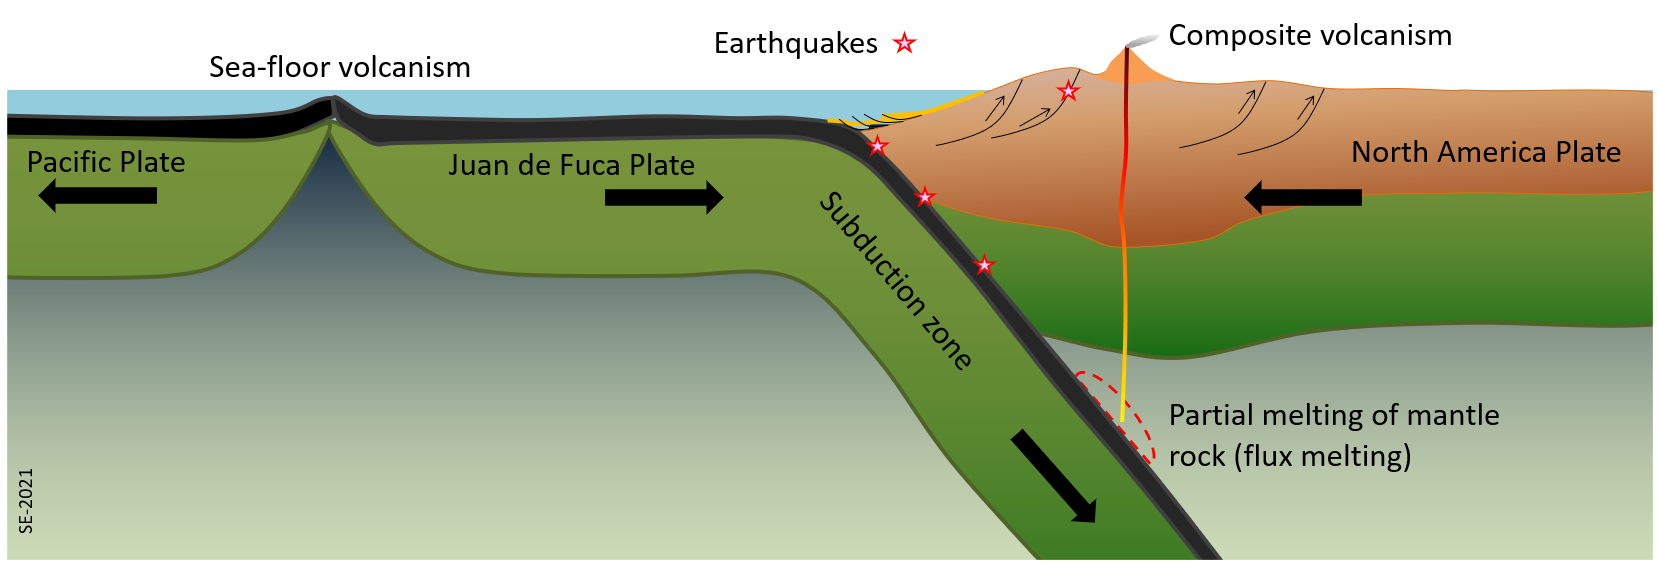
7.3 Volcanoes and Subduction
Typical distances from the subduction boundary to the volcanic arc are 250 to 300 km. At 40 km depth for each 100 km inland, the depth of the subducting slab directly beneath the volcanoes is in the range 80 to 100 km.
7.4 Kilauea’s June 2015 Lava Flow
The advance rate was 161 m/day or 6.7 m/hour
7.5 Volcanic Hazards in Squamish
- Tephra emission: It is a risk to aircraft.
- Gas emission: It is a risk in areas where gases plumes might flow from the eruption centre.
- Pyroclastic density current: It is a risk within a few 10s of km down flow.
- Pyroclastic fall: It may be a risk to building roofs in areas within several km of the eruption centre.
- Lahar: It is a risk within stream valleys down-flow from the eruption centre.
- Lava Flow: It is a risk within several km down flow.
- Sector collapse: It is a risk in areas within several km from the eruption centre.
7.6 Volcano Alert!
During the first day of field work the team should be finding and preparing several sites around the volcano (within a radius of several tens of km) where seismometers can be installed on bedrock, and also some locations on the volcano itself where tiltmeters can be installed on firm ground, to provide the best information about the seismic activity beneath the volcano and the movement of magma towards surface.
In the press release it should be stated that there is new evidence that Mt. Garibaldi is in the early stages of an eruptive cycle, and that we are actively monitoring the situation visually and with seismometers and motion sensors. We recommend that people should stay off the mountain, but that there is no immediate danger to residents of the Squamish region. Residents in the area and travellers should continue to monitor local media sources, and should subscribe to automated alert systems (e.g., https://www.emergencyinfobc.gov.bc.ca/?s=emergency+alerts) and should start making preparations and plans for an evacuation, should that become necessary.
8.1 Where Does it Come From?
Answers will vary depending what object is chosen.
The pen is made of plastics, which come from petroleum sources, and metals (mostly steel) that come from mines. The ink includes chemicals which come from a variety of sources. The colours of the ink may come from organic or mineral sources or from petroleum sources.
8.2 The Importance of Heat and Heat Engines
- Magmatic: Heat is necessary for magma to exist. The changes that take place during cooling lead to separation and concentration of the ore elements.
- Volcanogenic massive sulphide: Heat is necessary for magma to exist, but more important is that the heat of the volcanism drives the convection of water that is key to the ore-forming process.
- Unconformity-type uranium: Heat may be important to the convection process.
- Banded iron formation: It is unlikely that heat is a significant factor.
- Porphyry: Heat is provided by the intrusive igneous body and drives convection systems that bring ore elements into the areas where concentration takes place.
8.3 Sources of Important Lighter Metals
Typical sources for these elements are as follows:
- Silicon: quartz (SiO2) sand
- Calcium: calcite (CaCO3) extracted from limestone
- Sodium: halite (NaCl) extracted from evaporite deposits
- Potassium: sylvite (KCl) extracted from evaporite deposits
- Magnesium: dolomite ((Ca,Mg)CO3) from dolostone
9.1 Solar Potential
Answers will vary depending on location
9.2 Intermittent Wind and Solar Resources
| Mon | Tues | Wed | Thur | Fri | Sat | Sun | |
| Hours of sun | 4 | 10 | 10 | 10 | 8 | 2 | 3 |
| Hours of wind | 17 | 19 | 6 | 2 | 1 | 3 | 14 |
| Daily MWh solar | 360 | 900 | 900 | 900 | 720 | 180 | 270 |
| Daily MWh wind | 1700 | 1900 | 600 | 200 | 100 | 300 | 1400 |
| Daily total MWh | 2060 | 2800 | 1500 | 1100 | 820 | 480 | 1670 |
| No. homes | 76296 | 103704 | 55556 | 40741 | 30370 | 17778 | 61852 |
The facility operator will need to have agreements with other utilities to sell power at times when there is more energy than needed to supply the 50,000 homes, and to buy power from at times when there is less than needed. This is not just a daily trading requirement; it needs to operate on a minute by minute basis.
9.3 Power and Energy
1: (c) 5 kWh because a Wh is a unit of energy;
2: (a) 500 MW – which is how much power it can produce at maximum flow;
3: (c) 8 W, which is how much power it uses, (if left on for an hour it would consume 8 Wh of energy;
4: (d) 300 W
9.4 Geothermal Origins
- Iceland: divergent boundary volcanism (Mid-Atlantic Ridge – Eurasian and N. America Plates)
- Philippines: subduction volcanism (Philippines Plate subducting beneath Eurasia Plate)
- El Salvador: subduction volcanism (Cocos Plate subducting beneath Caribbean Plate)
- Costa Rica: subduction volcanism (Cocos Plate subducting beneath Caribbean Plate)
- Kenya: divergent boundary volcanism (East-Africa Rift, Africa Plate)
- Nicaragua: subduction volcanism (Cocos Plate subducting beneath Caribbean Plate)
- New Zealand: subduction volcanism (Pacific Plate subducting beneath Australian Plate)
9.5 Energy Sources by Region
Responses will vary by region.
10.1 Mechanical Weathering
The following are likely types of mechanical wehatering taking place here: exfoliation, freeze-thaw, tree-roots, foot traffic
10.2 Chemical Weathering
- Pyrite to hematite: oxidation
- Calcite to Ca and HCO3 ions: dissolution
- Feldspar to clay: hydrolysis
- Olivine to serpentine: hydrolysis
- Pyroxene to iron oxide: oxidation
10.3 The Weathering Origins of Sand
- Coral and other fragments: mechanical weathering by waves, some dissolution
- Angular sand grains: mechanical weathering by ice and then (to a limited degree) by a stream
- Olivine sand: mechanical weathering by waves
10.4 The Soils of Canada
Chernozem is restricted to the southern parts of Alberta, Saskatchewan and Manitoba because those areas are relatively dry and cool, dominated by native grasslands and underlain by relatively permeable sedimentary rocks (unlike the crystalline rocks of the nearby Canadian Shield).
Luvisol is present to the north of the chernozem belt of the southern prairies and in central British Columbia, areas that are transitional between grassland and either coniferous or deciduous forests.
Podsol is common in areas of southern Canada that have coniferous forests, including parts of northern Ontario, much of Quebec and the Maritimes, and the mountainous areas of British Columbia.
Brunisol is a coniferous forest soil that is common at the northern margins of the Boreal Forest.
Organic soil is common in poorly drained regions, especially in northern Ontario around Hudson Bay, and other parts of the Canadian Shiels that have poor drainage.
10.5 Clay Mineral Origins
- Halloysite: derived from feldspar under weathering conditions
- Mixed-layer clay: derived from smectite (which is derived from weathering of mafic rocks) under burial conditions (temperatures over 100 C)
- Serpentine: derived the pyroxene and olivine in mafic and ultramafic rocks under hydrothermal conditions
- Illite: formed from other clay minerals under hydrothermal conditions when potassium is present
- Dickite: Formed from other kaolin minerals (kaolinite or halloysite) at elevated temperatures
10.6 Find Some Clay in Your Neighbourhood
Answers will vary
11.1 Find a Leaking UST in Your Community
Answers will vary
11.2 What is a Turbidity Measurement?
Total suspended solids (TSS) values in mg/L:
Jan: 20.4, Feb: 34.0, Mar: 37.4, Apr: 153, May: 102, Jun: 160, Jul: 170, Aug: 34.0, Sep: 17.0, Oct: 10.2, Nov: 17.0, Dec: 13.6
TSS levels are highest in the warm months when flow levels are highest because of rapid melting in the mountains. Higher flows make the water more turbid and that stirs up more of the fine particulates on the stream bed.
11.3 Groundwater Flow Rate
V = (K x i)/n , where K is the permeability (0.0002 m/s in this case), i is the slope (= (37-21)/80 = 0.2) and n is the porosity (15% or 0.15)
V = (0.0002 x 0.2)/.15 = 0.00027 m/s
To travel the 80 m from the gas station to the creek could take 80/0.00027 = 296.296 seconds = 3.42 days
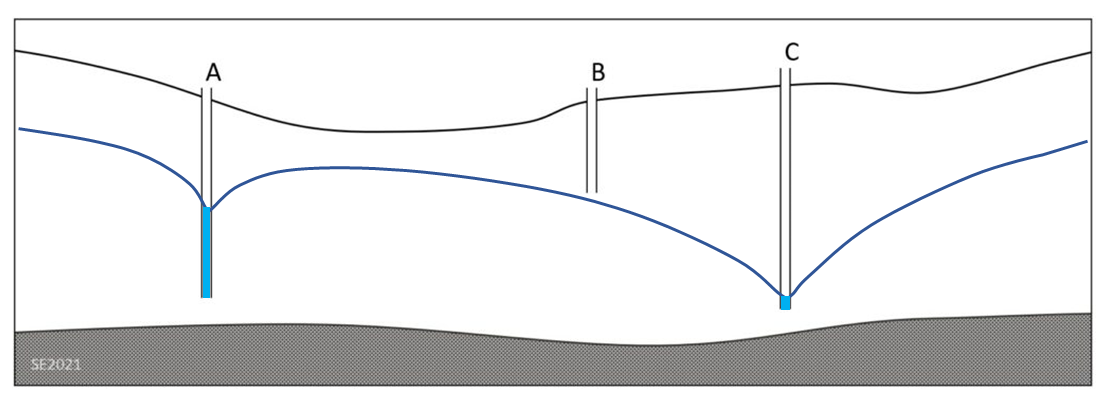
11.4 Cone of Depression
11.5 Where Does Your Water Come From?
Answers will vary
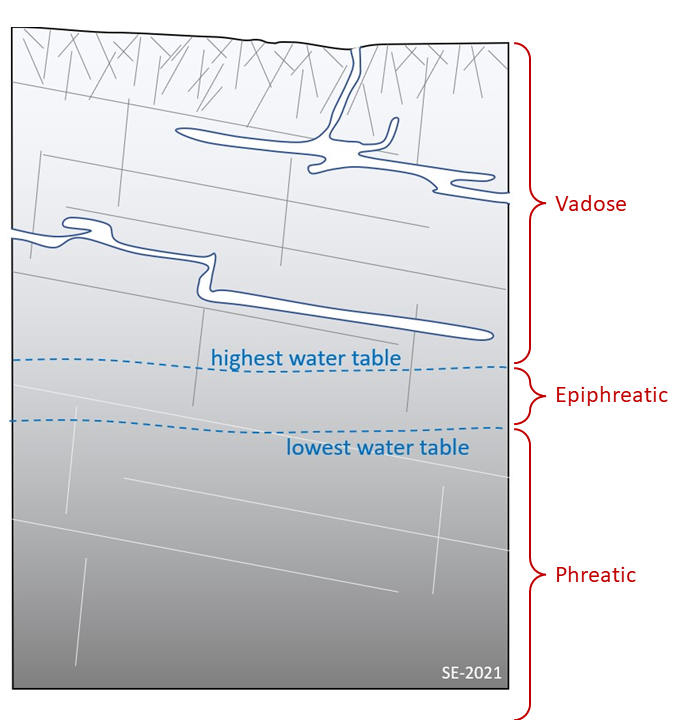
12.1 Finding the Zones in Karst
12.2 Comparing Groundwater Chemistry
Samples a, d and e are likely to be from a karst aquifer while samples b, c and f are likely to be from a sandstone aquifer. The karst aquifer has consistently higher levels of HCO3–, Ca2+ and Mg2+ than the sandstone aquifer, while the sandstone aquifer has much higher levels of Na+.
12.3 Deposition of Calcium Carbonate
- a soda-straw stalactite
- carbon dioxide is being lost from the water making calcium carbonate less soluble
- more carbon dioxide will be released, so more calcite will be deposited
- a stalagmite
12.4 Explore a Cave Near You
No answer.
13.1 More Bow River Flood Probabilities
1) The probability of a flood like the one in 1932 is 1 in 52.5 or 1.9%
2) The probability of a flood like the one in 1929 occurring next year is 1 in 40 or 2.5%
3) Ignoring the major floods, there is evidence of a small but consistent decrease in peak annual discharges over the period shown.
13.2 Estimating Flood Runoff
If 50,000 m3 of rain falls on a 1 km square area of Stanely Park, and the runoff coefficient is 0.15, then 7,500 m3 will flow over the surface (and the remaining 42,500 m3 will infiltrate). 7,5000 m3 flowing over 6 hours (21,600 seconds) represents an average flow rate of 0.35 m3/s.
14.1 The Low-Hanging Fruit
The most effective way to reduce the amount of organic waste going into landfills is by reducing the amount of food waste that we produce. We can reduce waste at many steps in the food chain by diverting to foodbanks, cooking less food in the first place, and always eating everything on our plates. Any excess organic waste can be captured through curbside green-bin programs. Where that isn’t possible some residents may be able to create their own organic recycling through regular compost containers or worm composters.
14.2 Does Your Landfill Meet the Siting Criteria for British Columbia?
Answers will vary.
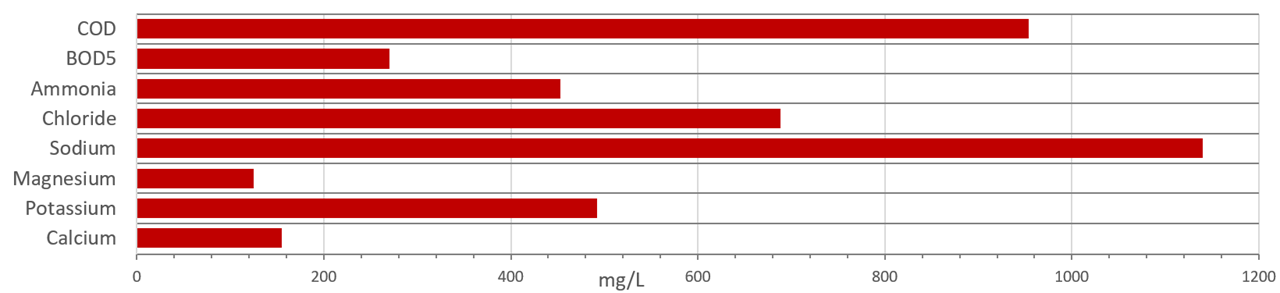
14.3 Visualizing Leachate Composition
14.4 What Happens to Your Wastewater?
Answers will vary.
15.1 Mountain Pine Beetles
The key implication, once the trees have died, is that there will be less root matter holding the soil in place, and so a greater likelihood of slope instability. Slope instability will also lead to increased fine sediment load in streams, and that may have implications for fish habitat. The death of trees in riparian areas (immediately adjacent to streams) will reduce the shading of stream water and so may lead to warmer waters which are less suitable for fish.
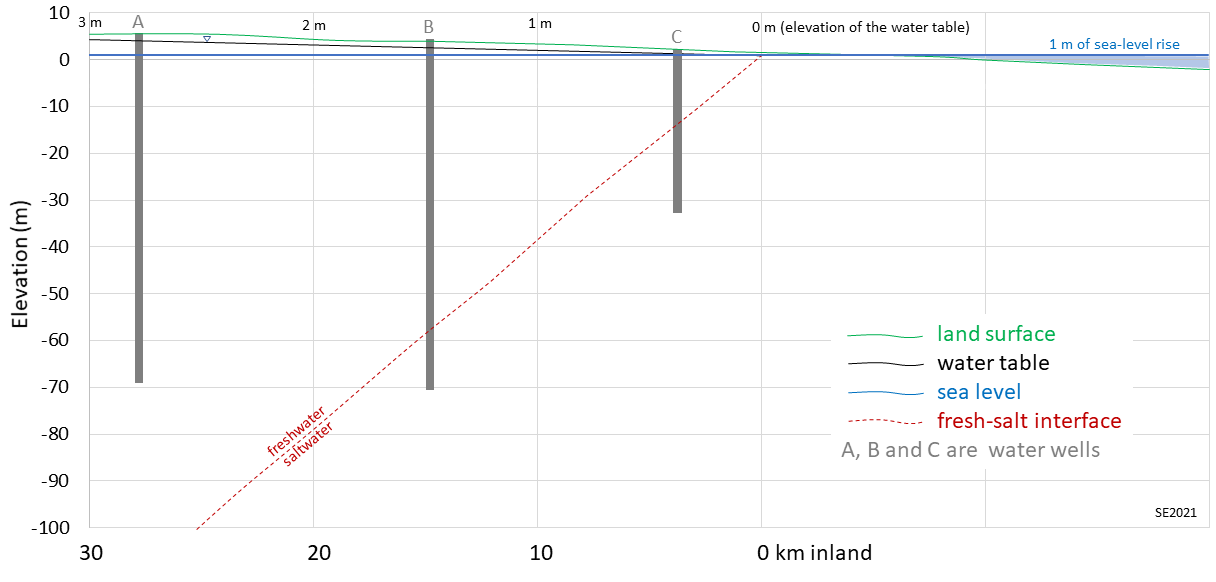
15.2 Groundwater Salinity and Sea Level Rise
Wells B and C will no longer provide fresh water under this scenario.