11.2 Anthropogenic Effects on Water Quality
Human activities are common causes of water-supply problems, and, in this regard, the most important activities are agriculture, industry, landfills, sewage, and anything that can lead to elevated turbidity. Anthropogenic sources are divided into two types, nonpoint sources where the effect is distributed over a large area such as agriculture or logging, and point sources, like factories, landfills or mines, where the effect is localized to a specific site.
By a wide margin, agriculture represents the greatest threat to water quality. Agriculture is everywhere, and it occupies more land than all other uses combined. There is currently 30% more agricultural land than forested land. Modern agriculture, while very efficient in terms of production per input dollar, is also intensively dependent on the use of chemicals (fertilizers and pesticides) and a significant proportion of the chemicals applied either run off the surface into streams and lakes, or seep into aquifers.
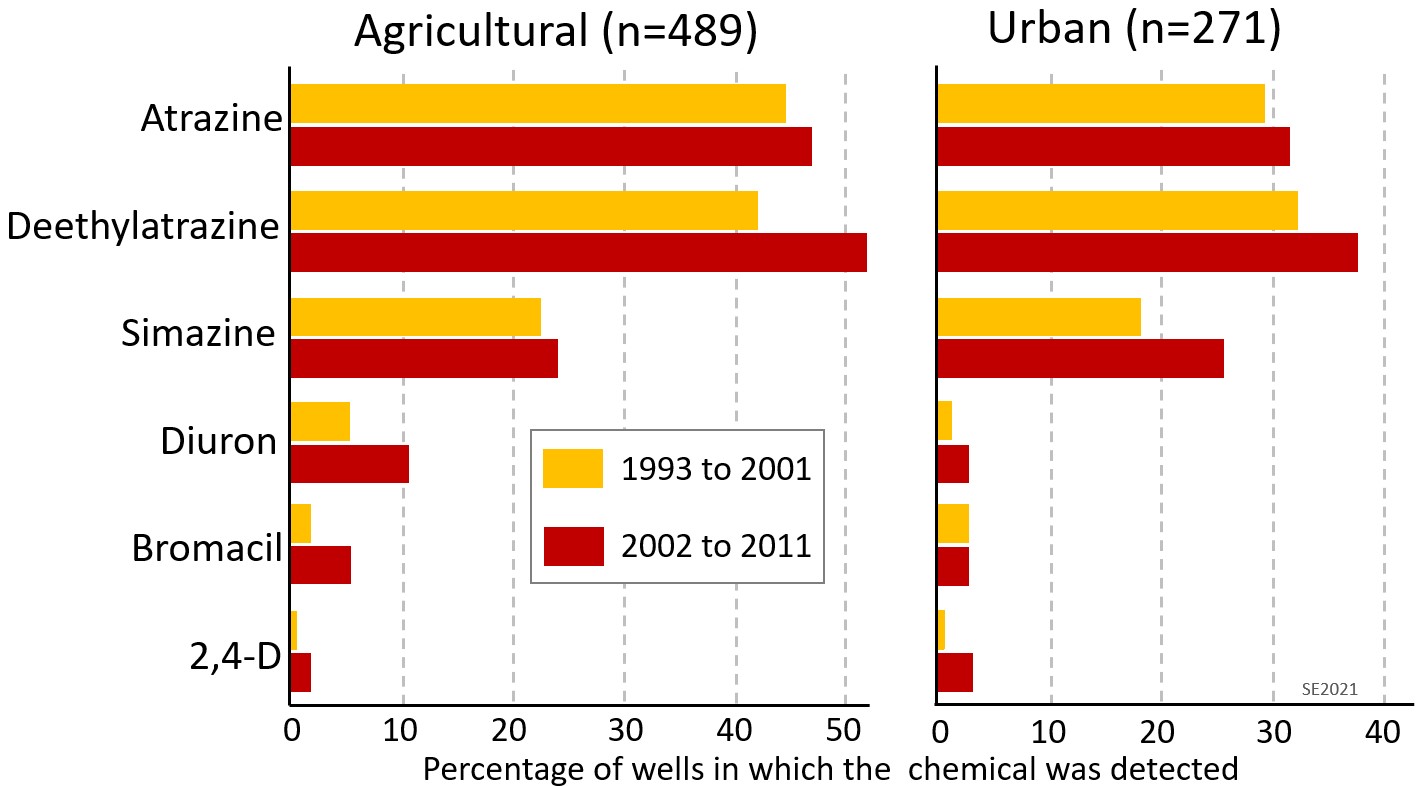
A two-decade study by the US Geological Survey has shown that the water in over 50% of wells tested in agricultural regions has detectable amounts of pesticides, that the issue is also prevalent in urban areas (because of pesticide use on golf courses and lawns) and that it was worse during the period from 2002 to 2011 than it was from 1993 to 2001 (Figure 11.2.1). Although the figure doesn’t show levels of pesticides in these wells, another study has shown that over 1000 wells in Florida have been closed because of pesticide levels above acceptable limits.[1]
Large amounts of nitrogen, phosphorous and potassium fertilizers are applied to fields all over the world. These nutrients help the crops to grow, but if more fertilizer is applied that is really needed, then the excess will end up making its way into the environment. Nitrogen from fertilizers can volatilize into the air, to come down within rainfall somewhere else. Nitrogen, phosphorous and potassium can run off fields into surface water bodies. They can also infiltrate down into the soil, and move downwards out of reach of the plant roots where they are added to the groundwater. That groundwater may discharge to a surface water body. In lakes and streams these excess nutrients help algae to thrive, and that can create significant problems for aquatic life and human water supplies and is also an issue for anyone who likes to be in or near the water.
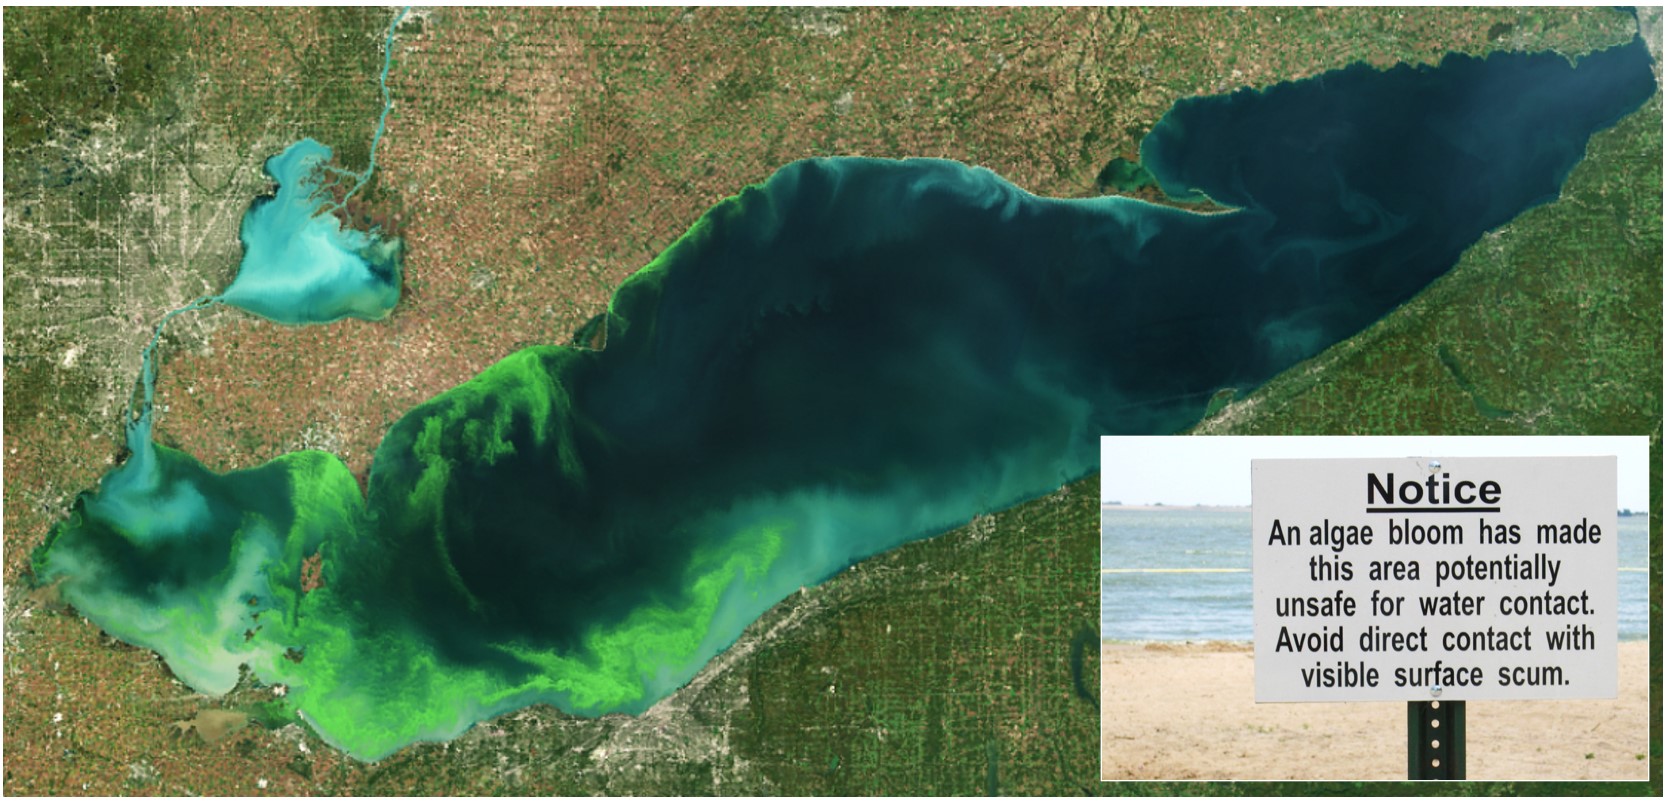
Lake Erie has long been the poster child for algal blooms related to excess nutrients, as is illustrated in a satellite image from 2011 (Figure 11.2.2). Erie is the shallowest of the Great Lakes (average depth is only 19 m, compared with 147 m for Lake Superior) and so has the greatest potential to warm up in the summer. The Erie drainage basin is also the most heavily populated of the Great Lakes (home to 12.4 million people) and the lake is entirely surrounded by farmland and cities and industry, with very little remaining forest. The western part of Lake Erie has a springtime phosphorous level of over 12 µg/L, whereas Lakes Superior and Huron are in the range of 2 to 3 µg/L, and Lake Ontario is just over 6 µg/L.[2]
Agriculture is a major source of the phosphorous that leads to excess algal growth in Lake Erie, but not the only one. Other important sources include municipal sewage effluent, industrial effluent, urban storm water runoff, and atmospheric deposition.[3]
Runoff from fields is not only laced with excess nutrients and pesticides, it is also rich in suspended matter that contributes to the turbidity of surface water, degrading aquatic ecosystems, and potentially endangering human water supplies (Figure 11.2.3). The risk of turbid runoff is greatest when fields have been left unprotected by vegetation following harvesting or tillage.

Nearly 80% of global farmland is dedicated to livestock, either for grazing or for growing animal feed (although livestock farming accounts for only 18% of the caloric output from farming)[4] and farm animals produce manure—lots of it. Manure from all livestock is rich in nitrogen, potassium and phosphorous, and so contributes to the surface water algae problem described above, and to elevated levels of nitrogen in groundwater.
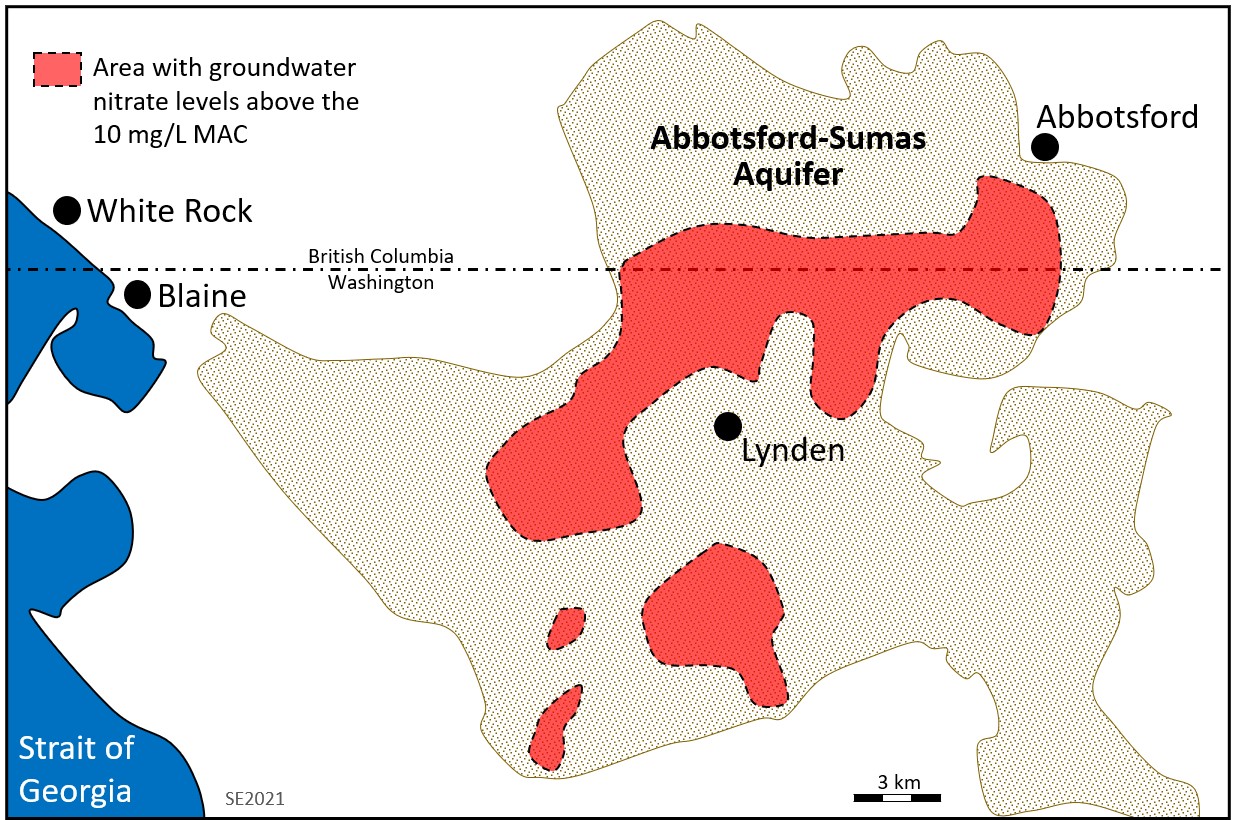
The Abbotsford-Sumas Aquifer of southwestern British Columbia and northwestern Washington provides a good example of how agriculture can affect groundwater quality. The area is intensively farmed with row crops (mostly raspberries and blueberries), large-scale poultry production and pastured livestock. In the past, manure from poultry operations was spread on raspberry fields. A 1992 study on the Canadian side of the border showed that 60% of 125 wells had nitrate levels above the 10 mg/L MAC for drinking water.[5] The Abbotsford-Sumas Aquifer slopes towards the south and crosses into northwestern Washington. A 1999 report[6] shows that the nitrogen contamination extended south across the border, although similar farming activities on the US side are responsible for much of that contamination. The extent of the nitrate contamination in the Abbotsford-Sumas Aquifer is shown on Figure 11.2.4.
In addition to nitrates and other nutrients, animal manure also contains bacteria, and while most of those bacteria are harmless to humans, some present a serious risk.
Walkerton Ontario, a town of about 5000 residents situated 150 km northwest of Toronto, has a water supply system sourced by wells in a fractured bedrock aquifer. One of those wells (Well 5) was shallow, drawing water from a depth of only 6 m. A heavy rainstorm in early May 2000 soaked a pasture that had been fertilized with cattle manure a few weeks earlier. Some of that water was introduced into the Walkerton water system from Well 5, situated 80 metres away from the pasture. In the following week 2300 residents became ill with gastroenteritis from the bacterium Escherichia coli in the water supply, and seven people died. Although Walkerton’s Public Utility Commission did routine tests for bacterial contamination, the testing protocols were not always followed nor were they as frequent as prescribed, monitoring records were falsified, and the utility’s chlorination system was set to a level below that stipulated by the Ontario Clean Water Agency. A public inquiry concluded that much of the blame for the Walkerton disaster can be traced back to provincial government cuts to funding for programs that had been established to protect citizens and ensure safe water supplies.[7] The Walkerton disaster spurred increased efforts to protect groundwater across Canada.
Logging, like agriculture, is a nonpoint source of pollution because it is carried out over wide areas, and it involves the application of fertilizers and pesticides and the removal of vegetation. But logging differs because it is often carried out on steep slopes—in the remaining forested areas that are too rugged for farming or urbanization—(Figure 11.2.5) and so the issue with erosion and turbid runoff is exacerbated. Most logging also operations also involve the construction of temporary roads on steep terrain. Road construction amplifies the risk of slope failure and that increases the likelihood of damage to surface water habitat and supplies.
Point sources of pollution include mines, petroleum extraction operations, plants for extracting and refining ores and petroleum, chemical works, manufacturing plants, sewage treatment systems, landfills and underground storage tanks (USTs) at filling stations. Some of these are discussed in other chapters (mining in Chapter 8, energy in Chapter 9, and landfills in Chapter 13) and therefore won’t be considered here.
Throughout the history of industrialization, owners and operators all of these types of facilities have failed catastrophically and repeatedly to protect the environment, water supplies, ecosystems and the lives and health of workers and innocent people. One of the most notorious examples was in the city of Niagara Falls, New York. In the 1920s the city set aside an abandoned canal—Love Canal—as a dump site for municipal waste. In 1942 the Hooker Chemical Company was given permission to dispose of chemical by-products from the manufacture of dyes, perfumes and rubber goods into the dump. From then until 1952 Hooker dumped nearly 20,000 tonnes of chemical wastes at the site, most of it in 200-litre metal drums, which they eventually covered up with clay. In 1952 they sold the site (which they had purchased from the city in 1947), along with the liability for the dumped chemicals, to the Niagara Falls Board of Education. A 400-student elementary school was built on top of the old dump and it was in use from 1955 to 1978. Soon after construction of the school, toxic chemicals started coming to surface, parts of the clay cover collapsed, and some of the metal drums were exposed at surface.[8] During heavy storms contaminated surface water ran off the site and into the Niagara River (and then over the falls). Contaminated groundwater also migrated offsite and into the basements of neighbouring homes. The Love Canal site was eventually cleaned up, and the school and surrounding homes abandoned, but there are lingering health issues amongst those who lived in the area.
There are industrial sites like Love Canal all over the world and their contamination legacies will be with us for decades, even centuries. Increasingly however, corporations and individuals are being held to account for making the assumption that they can dump whatever waste they need to get rid of onto the ground and into water and the air.
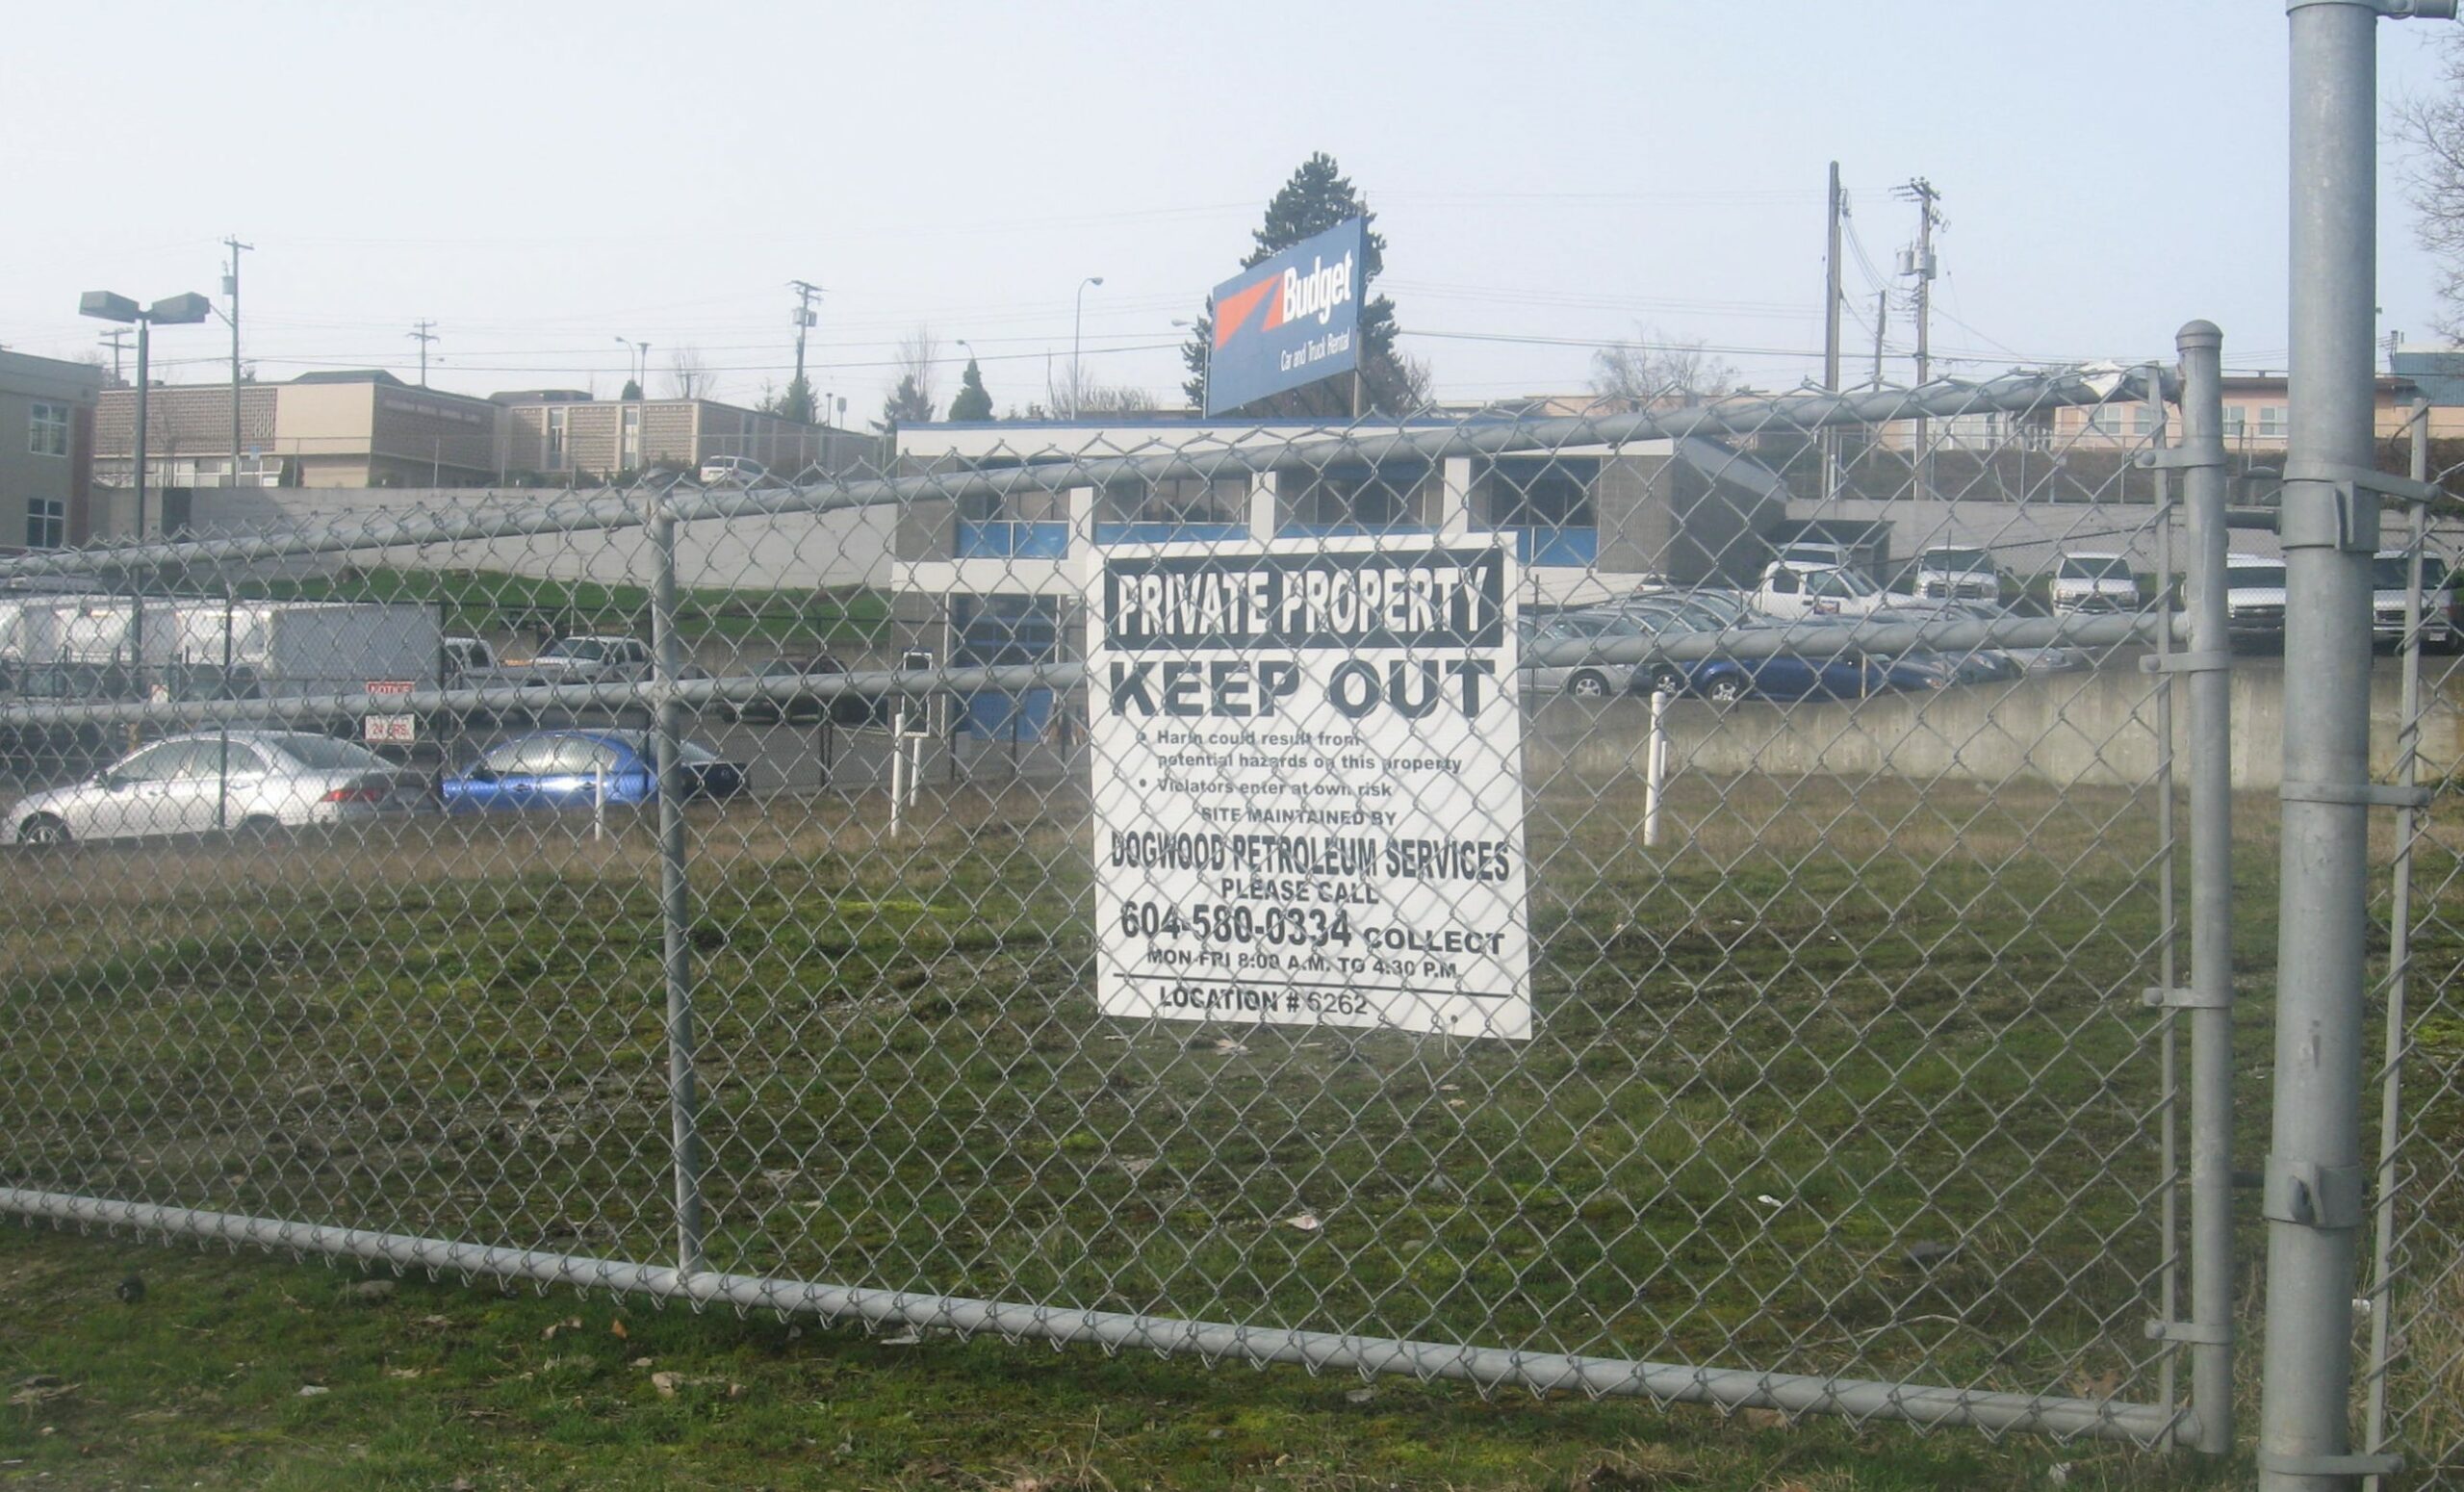
But it isn’t just large operations that are problematic. In virtually every village, town and neighbourhood in North America (and elsewhere as well) there are abandoned sites surrounded by chain link fences and dotted with the plastic pipes of monitoring wells. Many of these are the remains of gas stations with underground storage tanks (USTs) that had leaked so badly that the operation was forced to close. If you think you haven’t seen one, you probably just haven’t realized what they are. Some UST sites have been cleaned up and rehabilitated. The one illustrated on Figure 11.2.6 has been vacant for over 20 years, possibly because the value of the land is less than the cost of removing the contamination and making the site usable for some other purpose.
A leaking fuel UST is at least three problems in one (Figure 11.2.7). Some components of the fuel are volatile, and so will form a vapour phase that rises to surface and may enter nearby buildings. Most fuels used for vehicles like cars, trucks and planes are lighter than water and so will float along the surface of the saturated zone (the water table). Some components of the fuel are soluble in water and so will mix with groundwater and be dispersed in that way. Some components of the fuel may be heavier than water so will sink through the saturated zone. The aquifer water will eventually come to surface somewhere and will bring some of those dissolved and heavy constituents with it.

Exercise 11.1 Find a Leaking UST in Your Community
Most the USTs installed at gas stations in the past were made of steel with single walls and no corrosion protection, and so there is a very high probability that they have corroded and started to leak. Take a look around your community for abandoned gas stations (many of which are now just empty lots) that are surrounded by chain-link fences, like the one on Figure 11.2.6. Many will be at busy intersections. There is a good chance that over half of the gas stations that were established in your community prior to 2000 have compromised USTs and are now abandoned. Some may still be leaking fuel into the nearby aquifers.
Media Attributions
- Figure 11.2.1 Steven Earle, CC BY 4.0, based on data in Toccalino, P., Gilliom, R., Lindsey, B., Rupert, M. (2014). Pesticides in groundwater in the United States: Decadal-scale changes 1993-2011. Groundwater, 52, 112-125, via US Geological Survey, https://ca.water.usgs.gov/pubs/2014/ToccalinoEtAl2014.pdf
- Figure 11.2.2 Excess Nutrients Flowing in Lake Erie, satellite image from N.A.S.A., public domain; inset photo is public domain from U.S. Geological Survey, https://www.usgs.gov/media/images/excess-nutrients-flowing-lake-erie-can-cause-serious-algal-blooms
- Figure 11.2.3 Runoff of Soil by Lynn Betts, U.S. Department of Agriculture, public domain, via Wikimedia Commons, https://commons.wikimedia.org/wiki/File:Runoff_of_soil_%26_fertilizer.jpg
- Figure 11.2.4 Steven Earle, CC BY 4.0, based on maps in Leibscher et al. (1992). and in Carey, B. and Cummings, R. (2012). Sumas Blaine Aquifer nitrate contamination summary. Department of Ecology, State of Washington, Publication 12-03-026, https://apps.ecology.wa.gov/publications/documents/1203026.pdf
- Figure 11.2.5 Plum Creek Logging by Francis Eatherington, CC BY-NC 2.0, via Flickr, https://www.flickr.com/photos/umpquawild/2514317367
- Figure 11.2.6 Photo by Steven Earle, CC BY 4.0
- Figure 11.2.7 Steven Earle, CC BY 4.0
- Mateo-Sagasta, J., Marjani Zadeh, S., Turral, H. (2018). More people, more food, worse water? - A Global Review of Water Pollution from Agriculture. International Water Management Institute (IWMI), Colombo, Sri Lanka; Food and Agriculture Organization (FAO), Rome, Italy, http://www.fao.org/3/CA0146EN/ca0146en.pdf ↵
- Environment and Climate Change Canada. (2020). Canadian environmental sustainability indicators: Phosphorus levels in the offshore waters of the Great Lakes (accessed March, 2021). https://www.canada.ca/content/dam/eccc/documents/pdf/cesindicators/p-levels-offshore-great-lakes/2020/p-levels-offshore-waters-gl-en.pdf ↵
- Environment and Climate Change Canada. (2020) Phosphorus loading to Lake Erie (accessed March 2021). https://www.canada.ca/en/environment-climate-change/services/environmental-indicators/phosphorus-loading-lake-erie.html ↵
- Ritchie, H. (2019). Half of the world’s habitable land is used for agriculture. Our World in Data. https://ourworldindata.org/global-land-for-agriculture ↵
- Liebscher, H., Hii, B. & McNaughton, D. (1992). Nitrates and pesticides in the Abbotsford Aquifer, southwestern British Columbia. Environment Canada, Inland Waters Directorate. ↵
- Cox, S., Liebscher, H. (1999) Groundwater quality data from the Abbotsford-Sumas Aquifer of southwestern British Columbia and northwestern Washington State, February 1997. U.S. Geological Survey, Open File Report 99-244. https://doi.org/10.3133/ofr99244 ↵
- O’Connor, D. R. (2002). Report of the Walkerton Inquiry: The Events of May 2000 and Related Issues, Part One. Ontario Ministry of the Attorney General. http://www.archives.gov.on.ca/en/e_records/walkerton/index.html ↵
- Colten, C. E., Skinner, P. N. (1996). The road to Love Canal: Managing industrial waste before EPA. University of Texas Press. ↵