6.1 What is an Earthquake?
An earthquake is the shaking caused by the rupture (breaking) and subsequent displacement of rocks (one body of rock moving with respect to another) beneath the Earth’s surface. Most earthquakes are a result of the stresses placed on rocks in areas where adjacent tectonic plates are moving in different directions.
A body of rock that is under stress becomes deformed, and that deformation is elastic, meaning that the stressed rock can spring back into its original position. When the rock can no longer withstand the deformation, it breaks and the two sides slide past each other. Most earthquakes take place near to plate boundaries, but not necessarily right on a boundary, and not necessarily even on an existing or known fault.
The engineering principle of elastic deformation is illustrated on Figure 6.1.1. The stress applied to a rock—typically because of ongoing plate movement—results in strain or deformation of the rock (Figure 6.1.1b). Because most rock is strong (unlike loose sand for example), it can withstand a significant amount of deformation without breaking. But every rock has a deformation limit and will rupture (break) once pushed beyond that limit. At that point the rock breaks, there is displacement along the rupture surface, and the two bodies of rock that had been elastically deformed, rebound back to their original shape (Figure 6.1.1c). The magnitude of the earthquake depends on the extent of the area that breaks (the area of the rupture surface) and the average amount of displacement (sliding).

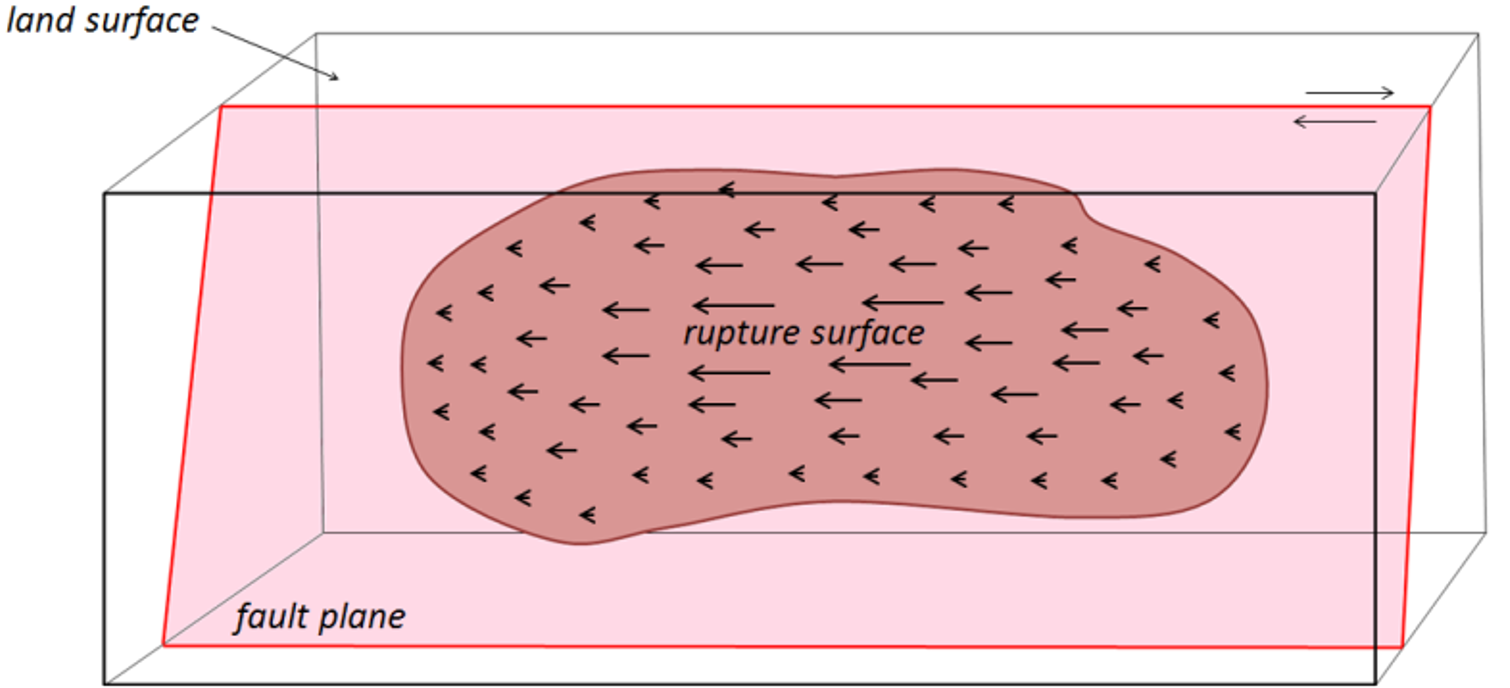
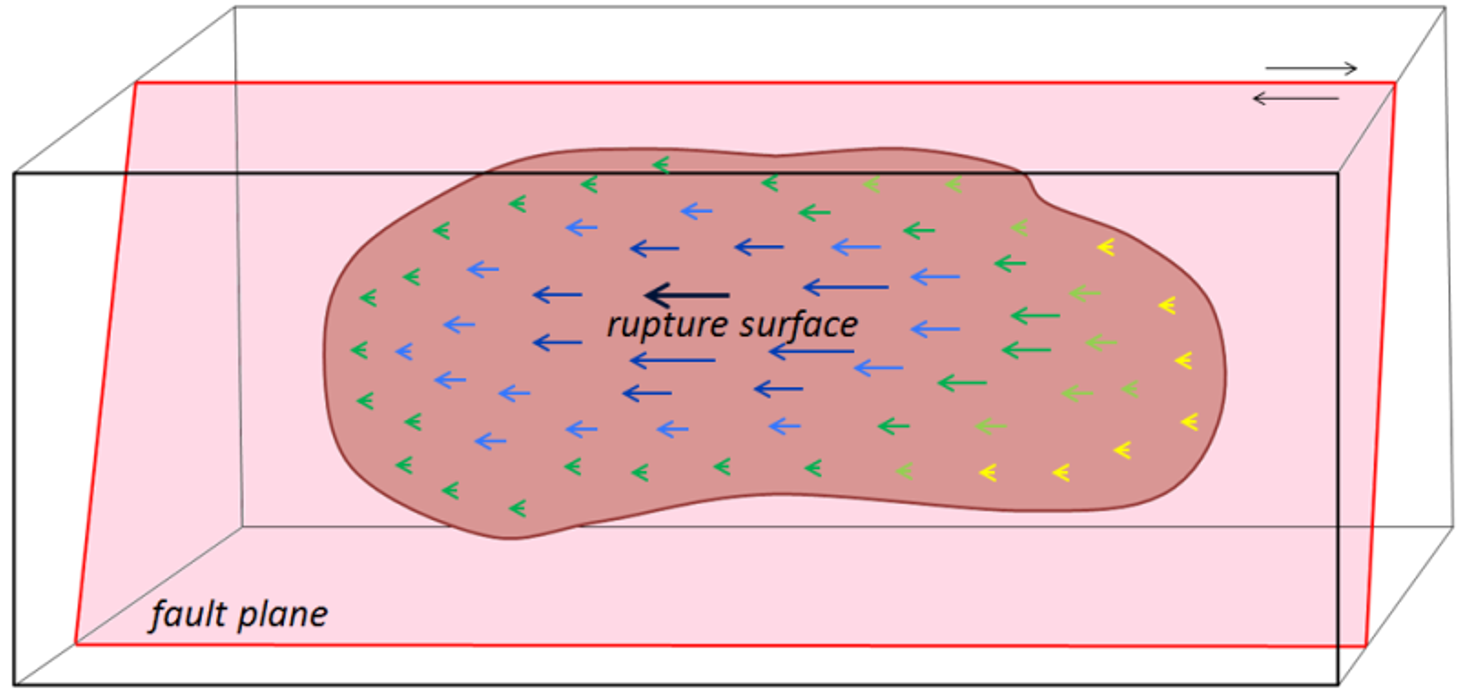
The concept of a rupture surface—which is critical to understanding earthquakes—is illustrated on Figure 6.1.2. An earthquake does not happen at a point, it happens over an area within a plane, although not necessarily a flat plane. Within the area of the rupture surface the amount of displacement is variable (Figure 6.1.2), and, by definition, it decreases to zero at the edges of the rupture surface because the rock beyond that point is not displaced at all. The extent of a rupture surface and the amount of displacement will depend on a number of factors, including the strength of the rock, and the degree to which it was stressed beforehand.
Earthquake rupture doesn’t happen all at once; it will start at a single point and spread rapidly from there (Figure 6.1.3). Depending on the extent of the rupture surface, the propagation of failures out from the point of initiation is typically completed within seconds to several tens of seconds. The initiation point isn’t necessarily in the centre of the rupture surface; it may be close to one end, or near to the top or the bottom.
Figure 6.1.4 shows the distribution of immediate aftershocks associated with the 1989 Loma Prieta earthquake. Panel a-b is a section along the San Andreas Fault, and this view is equivalent to what is shown in Figures 6.1.2 and 6.1.3. The area of red dots is the rupture surface; each red dot represents a specific aftershock that was recorded on a seismometer. The red star represents the initial or main shock. When that initial shock happened the rock at that location broke and was displaced. That released the stress on that particular part of the fault, but it resulted in an increase of the stress on other nearby parts of the fault and contributed to a cascade of smaller ruptures (immediate aftershocks), in this case over an area about 50 km long and 15 km wide (or “deep” as shown on Figure 6.1.4).
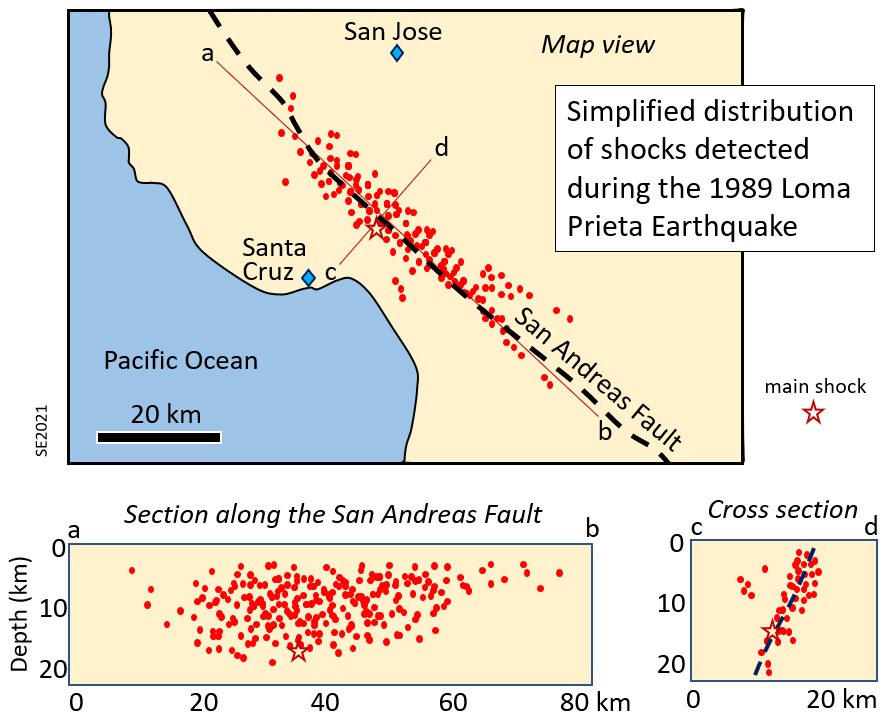
So, what is an aftershock then? An aftershock is an earthquake just like any other, but it is one that can be shown to have been triggered by stress transfer from a preceding earthquake. Within a few tens of seconds of the main Loma Prieta earthquake there were hundreds of smaller aftershocks; their distribution defines the area of the rupture surface.
Aftershocks can be of any magnitude. Most are smaller than the earthquake that triggered them, but they can be bigger. The aftershocks shown on Figure 6.1.4 all happened within seconds or minutes of the main shock, but aftershocks can be delayed for hours, weeks, years or even decades. As already noted, aftershocks are related to stress transfer. For example, the main shock of the Loma Prieta earthquake triggered aftershocks in the immediate area, which triggered more in the surrounding area, eventually extending for about 25 km along the fault in both directions and for 15 km towards the surface. But the earthquake as a whole also changed the stress on adjacent parts of the San Andreas Fault. This effect, which has been modeled for numerous earthquakes and active faults around the world, is depicted on Figure 6.1.5. Stress was reduced in the area of the rupture (blue) but was likely to have increased at either end of the rupture surface (red).
Stress transfer isn’t necessarily restricted to the fault along which an earthquake happened. It will affect the rocks in general around the site of the earthquake, and therefore may lead to increased stress on other faults in the region. And the effects of stress transfer don’t necessarily show up right away. Segments of faults are typically in some state of stress, and the transfer of stress from another area is only rarely enough to push a fault segment beyond its limits to the point of rupture. The stress that is added by stress transfer accumulates along with the ongoing build-up of stress from plate motion, to eventually lead to an earthquake.
Box 6.1 Episodic Tremor and Slip
Episodic tremor and slip is periodic slow sliding along part of a subduction boundary. It does not produce recognizable earthquakes, but does produce seismic tremor (rapid seismic vibrations on a seismometer that cannot be felt by humans). It was first discovered in 2003 on the Vancouver Island part of the Cascadia subduction zone.[1]
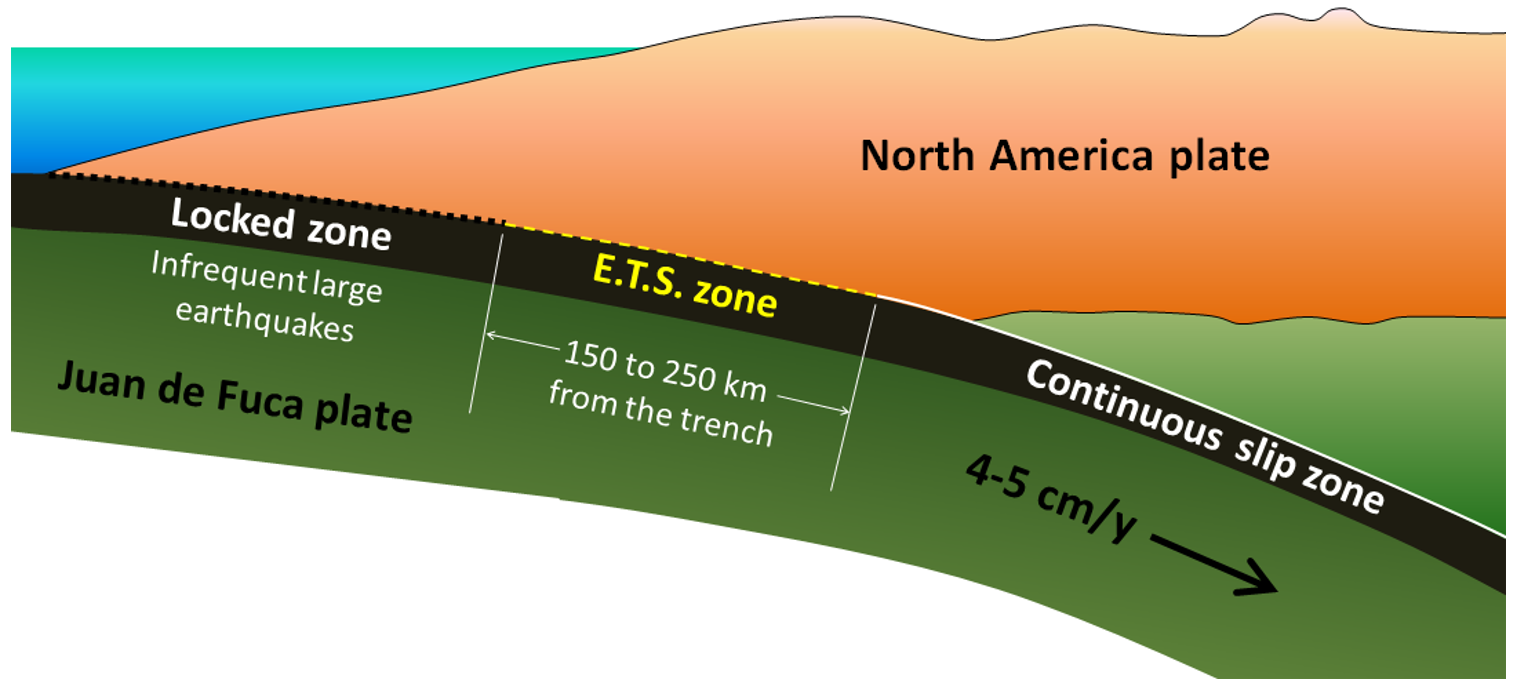
The boundary between the subducting Juan de Fuca plate and the North America plate can be divided into three segments, as shown on Figure 6.1.6. The rocks are locked together in the cold upper part of the boundary, and only move when there is a very large earthquake, in this case approximately every 500 years (the last one was M8.5+ on January 26, 1700). The lower part of the boundary is sliding continuously because the rock is warm and weak. The central part of the boundary isn’t cold enough to be locked, but isn’t warm enough to slide continuously. Instead it slips episodically, approximately every 14 months, slowly moving a few centimetres each time over a duration of about 2 weeks.
You might be inclined to think that it’s a good thing that there is periodic slip on this part of the plate because it releases some of the tension and reduces the risk of a large earthquake. In fact, the opposite is likely the case. The movement along the ETS part of the plate boundary acts like a medium-sized earthquake and leads to stress transfer to the adjacent locked part of the plate. Approximately every 14 months, during the two-week ETS period, there is a transfer of stress from the ETS zone up to the shallow locked part of the Cascadia subduction zone, and therefore an increased chance of a large earthquake.
Since 2003 ETS processes have also been observed on subduction zones in Mexico and Japan.
Media Attributions
- Figure 6.1.1 Steven Earle, CC BY 4.0
- Figure 6.1.2 Steven Earle, CC BY 4.0
- Figure 6.1.3 Steven Earle, CC BY 4.0
- Figure 6.1.4 Steven Earle, CC BY 4.0, based on figures in Ward, P, L. & Page, R.A., (1990). The Loma Prieta earthquake of October 17, 1989: A brief geologic view of what caused the Loma Prieta earthquake and implications for future California earthquakes: What happened … what is expected … what can be done, U.S. Geological Survey, https://doi.org/10.3133/70039527
- Figure 6.1.5 Steven Earle, CC BY 4.0
- Figure 6.1.6 Steven Earle, CC BY 4.0
- Rogers, T., & Dragert, H. (2003). Episodic tremor and slip on the Cascadia subduction zone: The chatter of silent slip. Science, 300(5627), 1942–1943. https://doi.org/10.1126/science.1084783 ↵