14.3 Leachate and Landfill Gas
Although waste is highly variable in composition—both from place to place within a single landfill, and from one landfill to another—the typical ingredients are generally similar to those shown on Figure 14.1.3. Even with diversion programs in place, a landfill will have a significant proportion of organic matter (food, hygiene products, etc.). Organic-bearing waste is also known as putrescible waste, meaning that it can be decomposed by microorganisms and chemical processes, resulting in the formation of gases, and the dissolution of some components into the surrounding water. Landfills will also always include some hazardous materials. At the Victoria landfill the “hazardous” part of the waste stream is dominated by paints and light bulbs, but also includes solvents, batteries, pesticides, and pharmaceuticals. And landfills will also always have some metals.
Waste placed in a landfill can be relatively moist to begin with, and more water is inevitably added as precipitation. Even where efforts are made to keep water out, the material in a landfill will be saturated at the base, while it may be unsaturated in the upper part. Deeply buried and water-saturated waste will quickly become anoxic because the biological and chemical reactions consume oxygen, while unsaturated waste may remain oxygenated. In other words, there are likely to be differences in the types of chemical reactions, and the reaction products, in the upper and lower parts of the waste pile.
Analyses of a variety of landfill leachates are listed in Table 14.3.1.[1] One of the key features of leachate water is that it typically has high concentrations of constituents that consume oxygen. Those might include reduced iron and manganese, sulphur (which can be oxidized chemically), and ammonia or dissolved or organic carbon (which can be oxidized chemically or biologically) and they are represented in the table as COD and BOD5. Leachate also has high levels of ammonia, and although it isn’t harmful to humans, it represents a significant risk to aquatic organisms. Ammonia (NH3) can be biologically converted to nitrate (NO3-), which is a serious problem for drinking water. COD, BOD and ammonia are present in leachates at concentrations that are several thousand times that of typical drinking water.
| . | . | United Kingdomi | . | Nanaimoii | . | Wysiekaiii | Typicaliv | Drinking Waterv |
| . | Recent | Aged | 30-UK-Irish | a | b | . | . | . |
| CODvi | 23800 | 1160 | 954 | nd | 80 | 896 | 18000 | ~10 |
| BOD5vi | 11900 | 260 | 270 | nd | nd | 106 | 1000 | <3 |
| AmmoniaN | 790 | 370 | 453 | 676 | 50 | 786 | 225 | <0.1 |
| Chloride | 1315 | 2080 | 688 | 2764 | 935 | nd | 500 | 10 |
| Sodium | 960 | 1300 | 1140 | 1192 | 575 | nd | 500 | 15 |
| Magnesium | 252 | 185 | 125 | 56 | 24 | nd | 250 | 5 |
| Potassium | 780 | 590 | 492 | nd | 43 | nd | 300 | 1 |
| Calcium | 1820 | 250 | 155 | 45 | 63 | nd | 1000 | 10 |
| Manganese | 27 | 2.1 | 0.5 | 0.12 | 1.2 | nd | nd | 0.03 |
| Iron | 540 | 23 | 12 | 2.4 | 6.8 | nd | 60 | 0.2 |
| Copper | 0.12 | 0.03 | 0.04 | 0.011 | nd | 0.07 | nd | 0.02 |
| Zinc | 21.5 | 0.4 | 0.16 | 0.07 | nd | 0.47 | nd | 0.01 |
Several of the other constituents listed in Table 14.3.1, including chloride, sodium, potassium and calcium are present at concentrations hundreds of times that of typical drinking water, while others (magnesium, manganese, iron, copper and zinc) are present at tens of times that of drinking water.
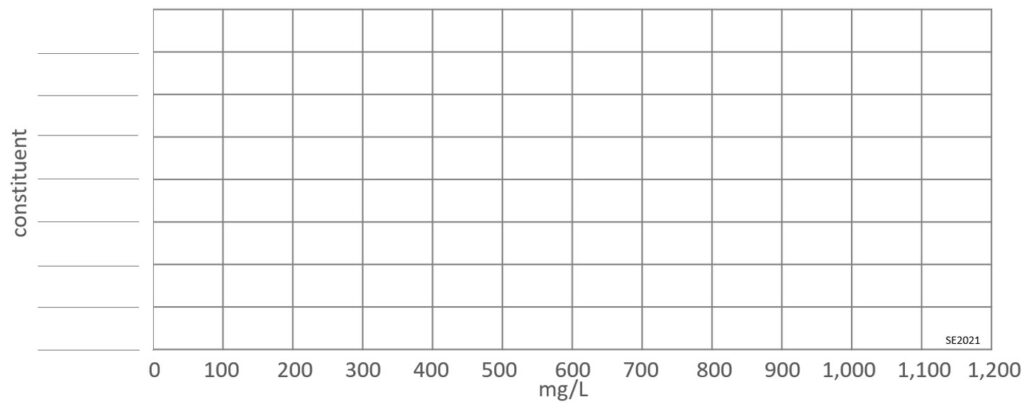
Exercise 14.3 Visualizing Leachate Composition
In order to understand some data it can be useful to plot the numbers on a diagram, and it’s especially useful if you do it by hand. Using the template below, create a horizontal bar diagram of the following constituents in the “30-UK-Irish” data set of Table 14.3.1: AmmoniaN (NH3), BOD5, COD, Ca, Cl, Mg, K and Na.
Exercise answers are provided Appendix 2

Precipitation of iron-oxide minerals is common where leachate is exposed to oxygen, as illustrated on Figure 14.3.1.
The evolution of leachate composition over time is illustrated on Figure 14.3.2. The waste near the top of a landfill is oxygenated (aerobic) when it is first placed, and that may remain the case (for months or years) until it is buried beneath other layers of waste and isolated from the atmosphere. During the aerobic stage water in contact with the waste is affected relatively little, although chloride levels increase early on, and some ammonia is generated. As conditions become anaerobic more ammonia is generated, along with acetic, lactic and formic acids—resulting in a drop in pH. Ethanol and methanol are also produced at this stage. The lower pH results in greater solubility for metals so their levels increase dramatically at that stage. The chemical oxygen demand increases because the water reacts with some of the abundant organic matter in the waste, and also because iron and ammonia levels go up. Waste that has been within a landfill for many decades gradually becomes less reactive and the concentrations of the components in the leachate eventually stop increasing.

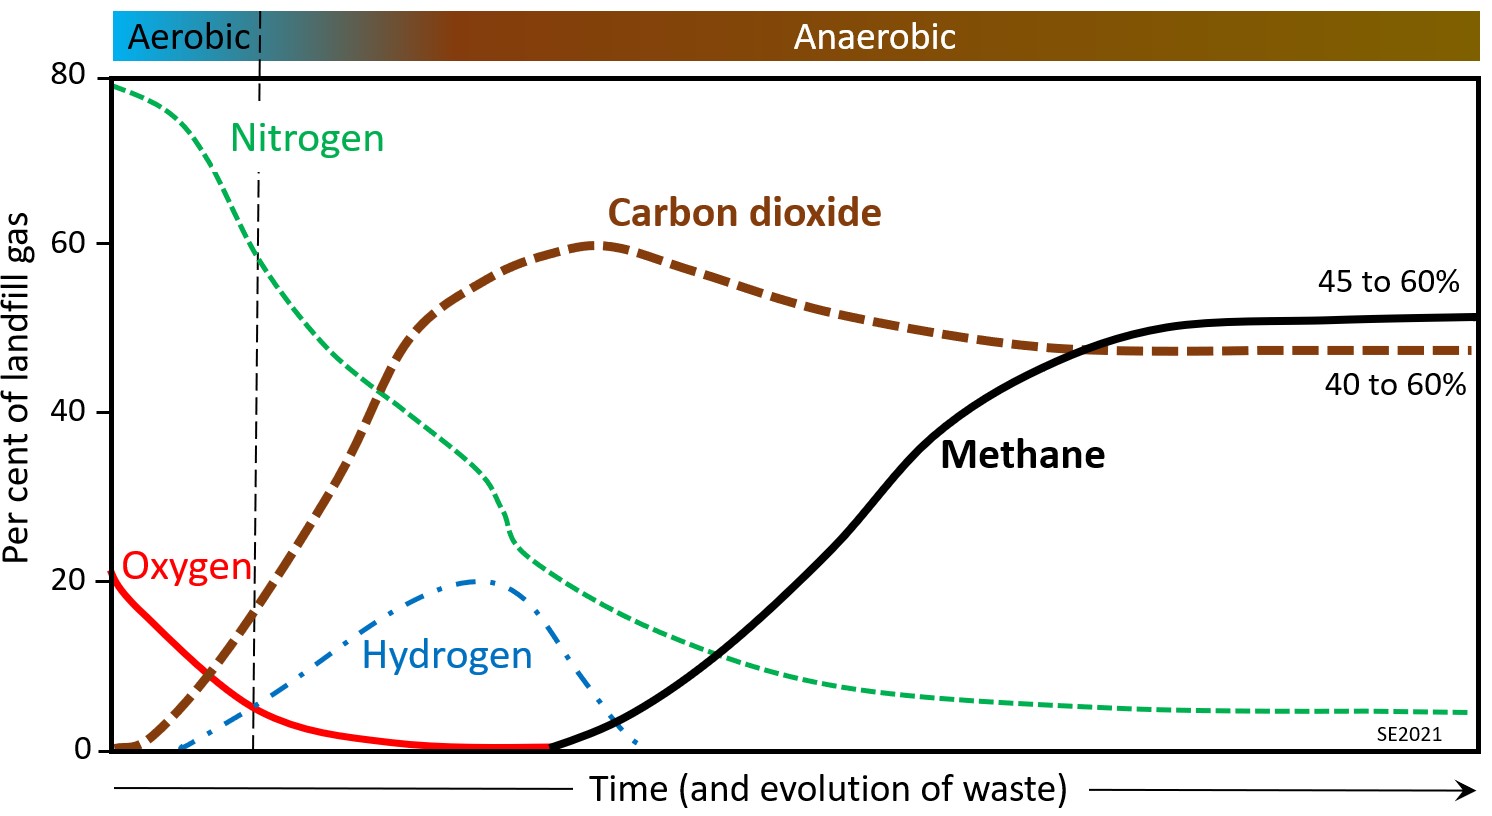
The proportions of gases within a landfill are shown schematically on Figure 14.3.3. In the early stage the composition reflects that of the atmosphere (79% nitrogen, 21% oxygen), but oxygen is quickly used up by aerobic bacteria, and nitrogen is slowly converted to ammonia and other dissolved nitrogen ions. Carbon dioxide is produced during both the aerobic and anaerobic stages due to the consumption of organic matter by microorganisms. Hydrogen is produced during the early part of the anaerobic stage, along with methane, but methane levels don’t start to rise until all of the oxygen is consumed (because methane reacts readily with oxygen). Methane production, derived from microbial processes, continues to increase through the anaerobic stage, but gradually levels off as organic matter within the waste is consumed. In most cases the proportions of methane and carbon dioxide are roughly equal in a mature landfill.
Waste within a landfill will produce a significant amount of gas within 1 to 3 years of being placed, with peak gas production at around 5 to 7 years, and relatively little gas production after 20 years.
Media Attributions
- Figure 14.3.1 Photo by Steven Earle, CC BY 4.0
- Figure 14.3.2 Steven Earle, CC BY 4.0, based on a diagram in the Department of the Environment. (1995). Landfill Design, Construction and Operational Practice, Waste Management Paper No. 26B. UK Dept. of the Environment.
- Figure 14.3.3 Steven Earle, CC BY 4.0, based on a public domain diagram in US Energy Information Administration. (n.d.). Biomass explained: Waste-to-energy (Municipal Solid Waste). https://www.eia.gov/energyexplained/biomass/waste-to-energy-in-depth.php
- UK data from the Department of the Environment. (1997). Landfill completion: A technical memorandum providing guidance on assessing the completion of licensed landfill sites. Waste Management Paper No. 26A; and from Environmental Protection Agency. (1997). Landfill manuals: Landfill operational practices. EPA Ireland.; Nanaimo landfill data provided by the Regional District of Nanaimo in 2012, Poland data from Kulikowska, D. (2012). Nitrogen removal from landfill leachate via the nitrite route. Brazilian Journal of Chemical Engineering, 29(2). https://doi.org/10.1590/S0104-66322012000200002; "Typical landfill" data from: Tchobanoglous, G. & Kreith, F. (2002). Handbook of solid waste management (2nd ed.), McGraw Hill Handbooks. ↵