3.5 Ocean Currents and Climate Change
Ocean currents are critically important in redistributing thermal energy and water on Earth. They have played important roles in past climate changes, and will be important in future climate changes.
The major surface currents of the world’s oceans are shown on Figure 3.5.1. Because of the Coriolis effect, currents tend to have a clockwise pattern in the northern hemisphere and a counter-clockwise pattern in the southern hemisphere. Currents that flow towards the equator generally bring cold water into warmer regions (blue arrows), while those that flow toward the poles bring warm water into colder regions (red arrows). In general, although not in all cases, currents that flow generally east-west have a neutral role when it comes to redistributing heat.
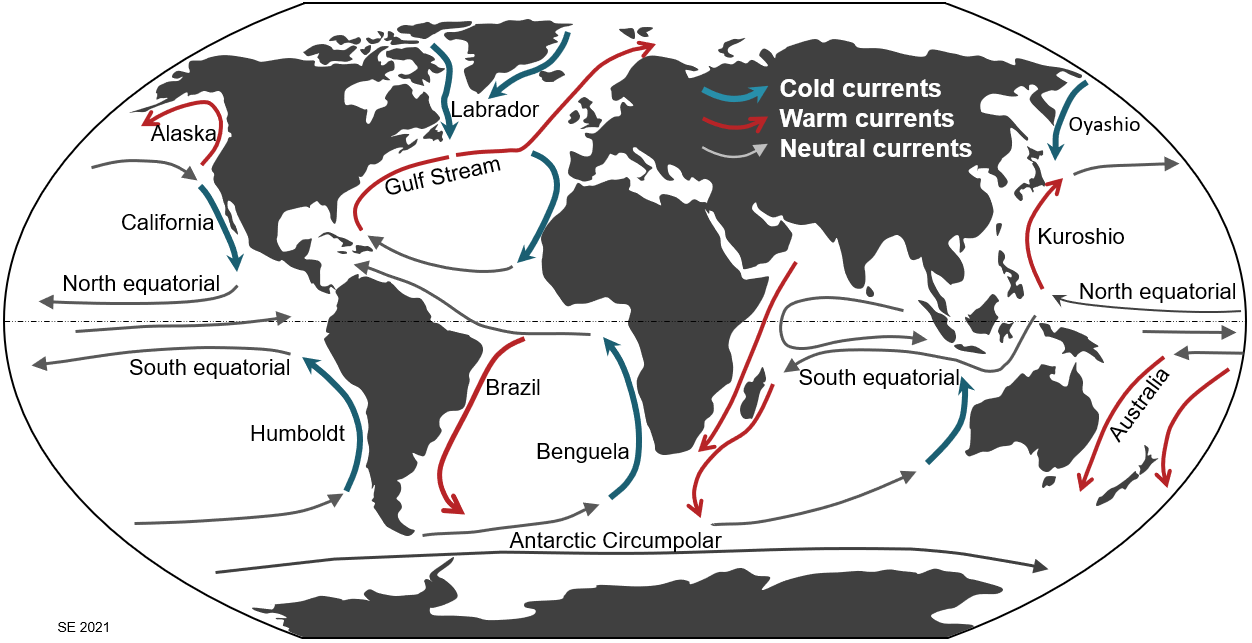
The currents shown on Figure 3.5.1 are surface currents and, as such, they are confined to the upper 400 m of the oceans; most of the flow is within the upper 100 m. But there are also significant deep-flow currents, and those plays an equally important role in the redistribution of heat on the planet. Some of that deeper flow is shown on Figure 3.5.2. This is known as the thermohaline circulation system, where the term “thermohaline” implies that these flows are driven—at least in part—by both the temperature and the salinity of the water. These factors determine the density of the water in the currents, and that is critical to the thermohaline circulation.

Pure water at 20⁰ C has a density of 998 grams/litre (g/L). Typical salty ocean water (3.5% salinity) at 20⁰ C has a density of 1025 g/L. Ocean water salinity ranges from about 3.3% in areas where there is a lot of rain or a lot of freshwater input from rivers, to about 3.8% where there is strong evaporation and relatively little freshwater input. The higher the salinity, the greater the density. Ocean water temperature ranges from around 30⁰ C in the tropics to a little less than 0⁰ C[1] in polar regions. The lower the temperature, the greater the density, because a kilogram of cold water occupies less volume than a kilogram of warm water.
The water of the Gulf Stream flowing past Florida has a salinity of around 3.65%, a typical temperature of about 28⁰ C and density of about 1024 g/L. As this water flows north beyond Iceland its salinity drops only a little, to about 3.45% (due to rain and river input), while its temperature drops a lot, to about 2⁰ C. That cold salty water has a density of about 1028 g/L, making it the densest water anywhere in the open ocean, and quite a lot denser than the equally cold but much less salty water underneath. Because of this high density, the surface water in that region sinks and becomes part of deep flow system. It remains submerged as it moves south through the Atlantic and east past Africa, then it resurfaces either in the Indian Ocean—east of Madagascar—or in the northern part of the Pacific Ocean—north of Hawaii (Figure 3.5.2). This thermohaline circulation is important in controlling the Earth’s climate.
Glacial ice cores collected from Greenland and Antarctica have revealed some striking temperature variations over the past few hundred thousand years, especially during the more intense parts of the Quaternary glaciations, and it has been shown that much of that variability is related to changes in current flow patterns. Figure 3.5.3 shows the temperature record for the period from 44 to 26 ka, as determined in core samples from a drill hole in central Greenland.

These temperature swings, in the order of 6 to 10⁰ C, on time scales of 1000 to 2000 years are known as Dansgaard-Oeschger cycles, in honour of the Danish (Willi Dansgaard) and Swiss (Hans Oeschger) scientists that first described them.
There is strong consensus, amongst marine scientists and climatologists, that the key factor in controlling Dansgaard-Oeschger cycles is variability in the salinity of the northern Atlantic Ocean. This process is known as the “salinity oscillator”. As already described, evaporation in the equatorial part of the Atlantic increases the salinity of the Gulf Stream. In the far north Atlantic, this still salty and now cold water sinks to become part of the subsurface flow that eventually comes back to surface in the Indian and Pacific Oceans (Figure 3.5.2). That represents a net movement of salt out of the Atlantic basin, and gradually (over hundreds of years) results in a decrease in the overall salinity of the Atlantic water. Another part of the process is related to the northward transportation of heat by the Gulf Stream, which makes the Arctic region warmer than it would be otherwise, and that leads to more melting of glacial ice in Greenland and northern Canada, further diluting the Atlantic.
As the Atlantic slowly becomes less salty and as the melting of northern glaciers make it fresher still, the tendency for the cooled Gulf Stream water to sink in the far north Atlantic is reduced, and therefore the strength of the overall thermohaline circulation system decreases. That means that less heat is transported north, the Arctic region cools, less salt is removed from the Atlantic basin, and glacier-melting slows so that less freshwater flows into the ocean.
The salinity oscillator process is illustrated on Figure 3.5.4, which is focused on Dansgaard-Oeschger events 6 and 7. The dashed curve is not based on data; it is simply a representation of slow changes in the salinity of the Atlantic Ocean and the strength of the thermohaline circulation (THC). When the THC is strong—because the salinity is high—western Europe and the Arctic region are warmed. A strong THC tends to slowly reduce Atlantic salinity, both because salty water is moved out of the Atlantic basin and because Arctic melting is enhanced. This slowly weakens the THC, and the Arctic cools. With a weaker THC and less Arctic melting, the salinity slowly increases. The entire cycle takes about 1500 years on average, although in the case illustrated the time between peaks is 1750 years.

Exercise 3.3 Ocean Water Densities
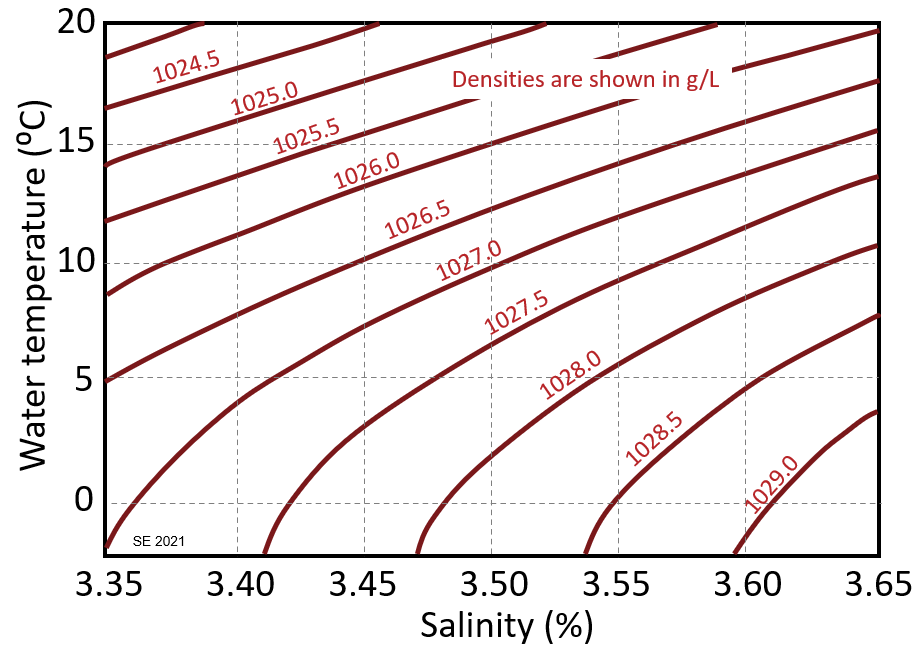
The density of ocean water is a function of its temperature and salinity, and the relationship is shown on Figure 3.5.5, where density (red lines) is expressed in g/L. For example, at a salinity of 2.5% and a temperature of 10⁰ C, the density is 1027 g/L. The table has a list of salinities and typical water temperatures for some offshore locations, some within the Gulf Stream in the Atlantic and two within the Pacific. Use the graph to estimate the water densities at these locations.
| Location | Salinity (%) | T (° C) | Density (g/L) |
| North Carolina | 3.64 | 20 | |
| Newfoundland | 3.58 | 15 | |
| Iceland | 3.52 | 9 | |
| Svalbard | 3.45 | 2 | |
| Baja Sur | 3.4 | 20 | |
| Los Angeles | 3.35 | 13 |
Media Attributions
- Figure 3.5.1 Steven Earle, CC BY 4.0, based on a US Government public domain image, Corrientes-oceanicas, by Dr. Michael Pidwirny, via Wikimedia Commons, https://commons.wikimedia.org/wiki/File:Corrientes-oceanicas.png
- Figure 3.5.2 Steven Earle, CC BY 4.0, based on maps of thermohaline circulation from various sources.
- Figure 3.5.3 Steven Earle, CC BY 4.0, data, public domain, from NOAA, https://www.ncdc.noaa.gov/data-access/paleoclimatology-data/datasets/ice-core, originally described by: Alley, R. B. (2000). The younger dryas cold interval as viewed from central Greenland. Quaternary Science Reviews, 19(1-5), 213-226. https://doi.org/10.1016/S0277-3791(99)00062-1. The Dansgaard-Oeschger cycles: Dansgaard, W. (1984) North Atlantic climate oscillations revealed by deep Greenland ice cores. In Hanson, J. E. & T. Takahashi (Eds.), Climate processes and climate sensitivity. American Geophysical Union, 288-298; and by: Dansgaard, W., Johnsen, S., Clausen, H. et al. (1993). Evidence for general instability of past climate from a 250-kyr ice-core record. Nature 364, 218–220. https://doi.org/10.1038/364218a0
- Figure 3.5.4 Steven Earle, CC BY 4.0, from the same data source as Figure 3.5.3.
- Figure 3.5.5 Steven Earle, CC BY 4.0
- Yes, liquid water can exist below 0⁰ C, especially if it is salty. ↵