15.3 Extreme Weather Events
The year 2020 was a record year for tropical storms in the Atlantic basin. There were 30 named storms, which is two higher than the previous record of 28 (in 2005), and 2005 and 2020 are the only years in which the Greek alphabet had to be used for Atlantic storm names because there aren’t enough letters in the Roman alphabet. Of the 28 storms 2020, 14 were classified as hurricanes and 6 were classified as major hurricanes, both of those numbers are just 1 shy of the record. Five of the 2020 Atlantic tropical storms can be seen—active at the same time—on Figure 15.3.1.
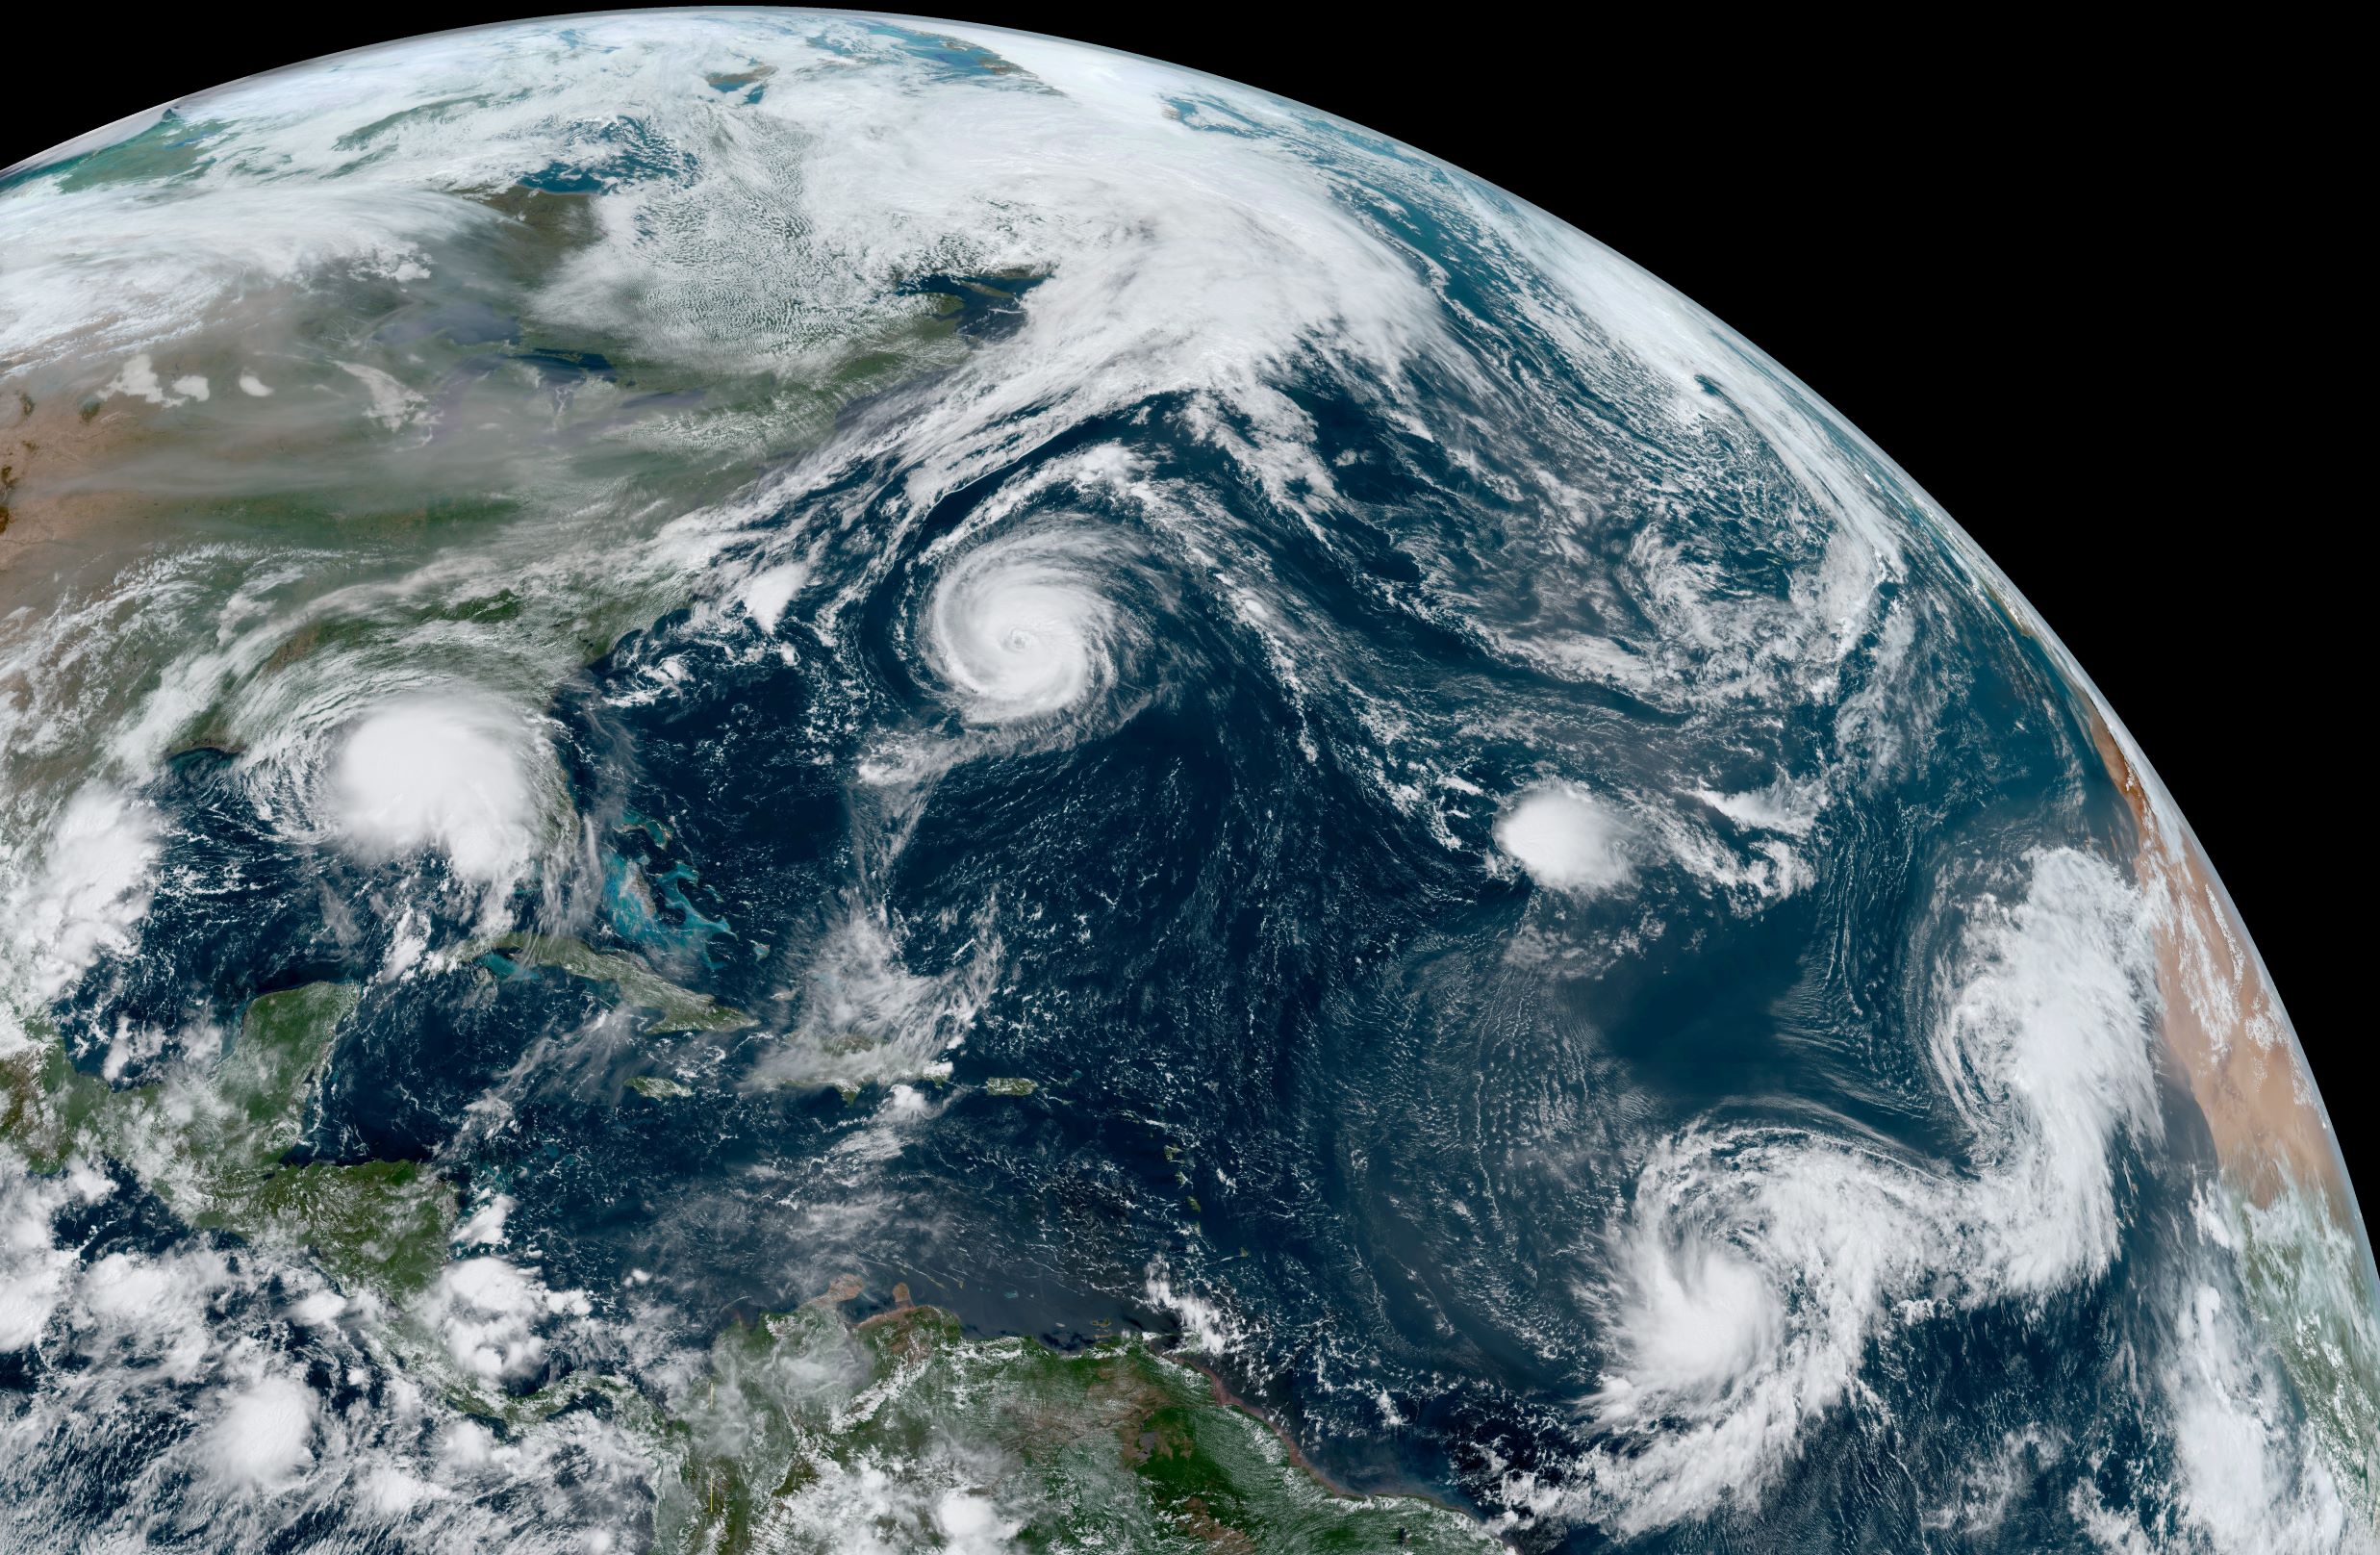
There are two main reasons that 2020 was such a remarkable year for Atlantic tropical storms. One is that it wasn’t a strong El Niño year (Atlantic tropical storms are less likely to develop under strong El Niño conditions). The other is that our climate is getting hotter, there is more heat stored in the surface waters of the ocean, and that heat is what powers tropical storms. The correlation between the global temperature and the number of tropical storms per year is illustrated on Figure 15.3.2. The numbers of both tropical storms and temperatures were relatively flat from 1880 to 1930, but both values have climbed steadily and steeply since about 1960.

Large storms—not just tropical storms—have several important implications for geological processes, including destruction in coastal areas because of the storm surge, flooding inland because of intense rainfall, and triggering of slope failures because intense rainfall has weakened material on slopes.
Storm surge—the increase in water level when a large storm approaches land—results from three main factors:
-
- The strong winds push water towards the coast, forcing it to “pile up” against the shore potentially reaching several metres above normal sea level,
- The very low barometric pressure associated with large storms creates a bulge in the water surface, and for a typical intense storm this bulge could be over 1 m above the surrounding sea surface, and
- Large waves can add several metres more height to the surge.
Some of the largest storm surges have been over 8 metres above typical high tide levels, and those have caused extreme damage, such as that visible on Figure 15.3.3, showing coastal Texas in 2008. If you look closely at that image, you can see that only a handful of buildings remain (out of several hundred), a bridge has been damaged, a highway has been washed out in some areas, and parts of the land have been severely eroded. What was formerly a straight coast (on the right) is now significantly embayed with evidence of damage to structures designed to prevent coastal erosion.

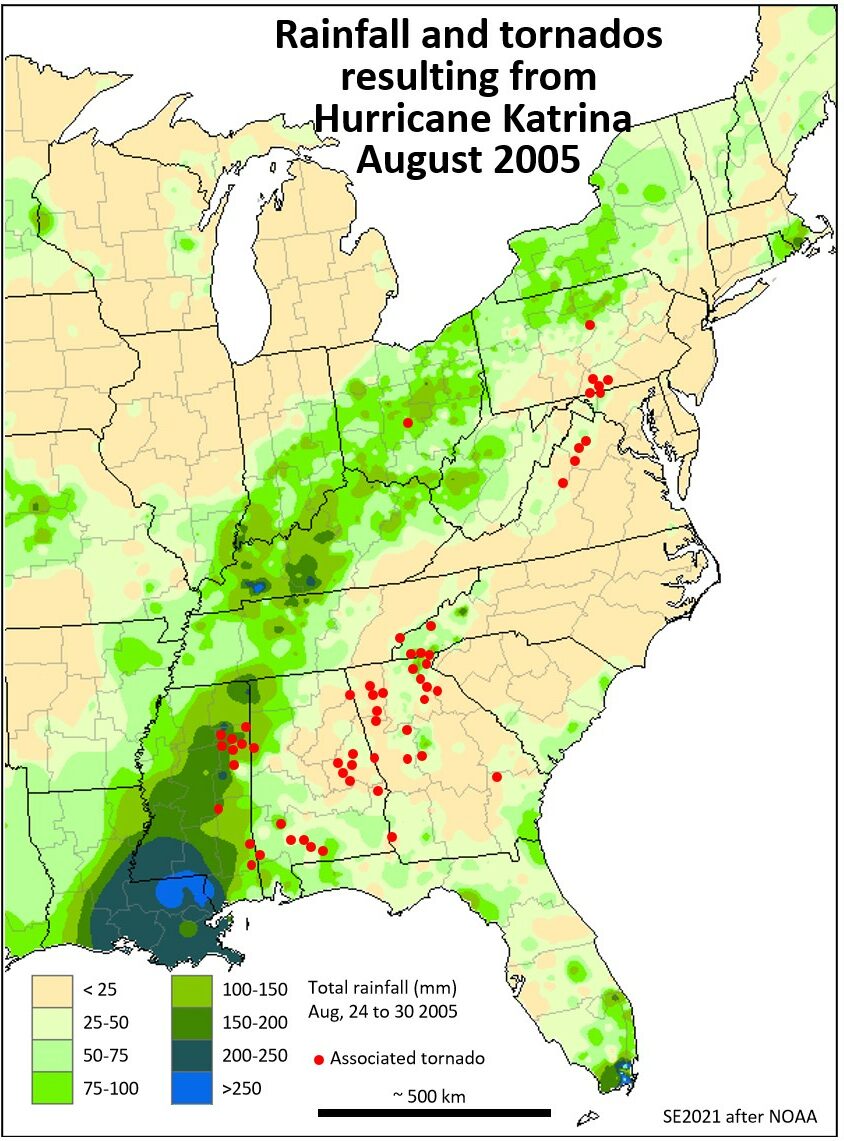
We typically associate tropical storm damage and casualties with heavy winds, giant waves and storm surges, but in fact most deaths associated with tropical storms (59%) result from freshwater flooding. Tropical storms carry massive amounts of water, and a lot of that falls as torrential rain after they cross over onto land. As shown on Figure 15.3.4, heavy rainfall associated with Hurricane Katrina in 2005 extended across at least 8 states and even into southern Canada. Much of the resulting flooding occurred near to the coast in Louisiana and Mississippi, but it also affected areas over a thousand kilometres inland. A total of 62 tornadoes, which led to two deaths and $23 million in damages, were spawned from Hurricane Katrina as it spun across the continent and those are also shown on Figure 15.3.4. As described in Section 13.2, Hurricane Harvey dumped record-breaking amounts of rain on parts of Texas in August 2017, leading to 100 deaths and over $125 billion in damages.
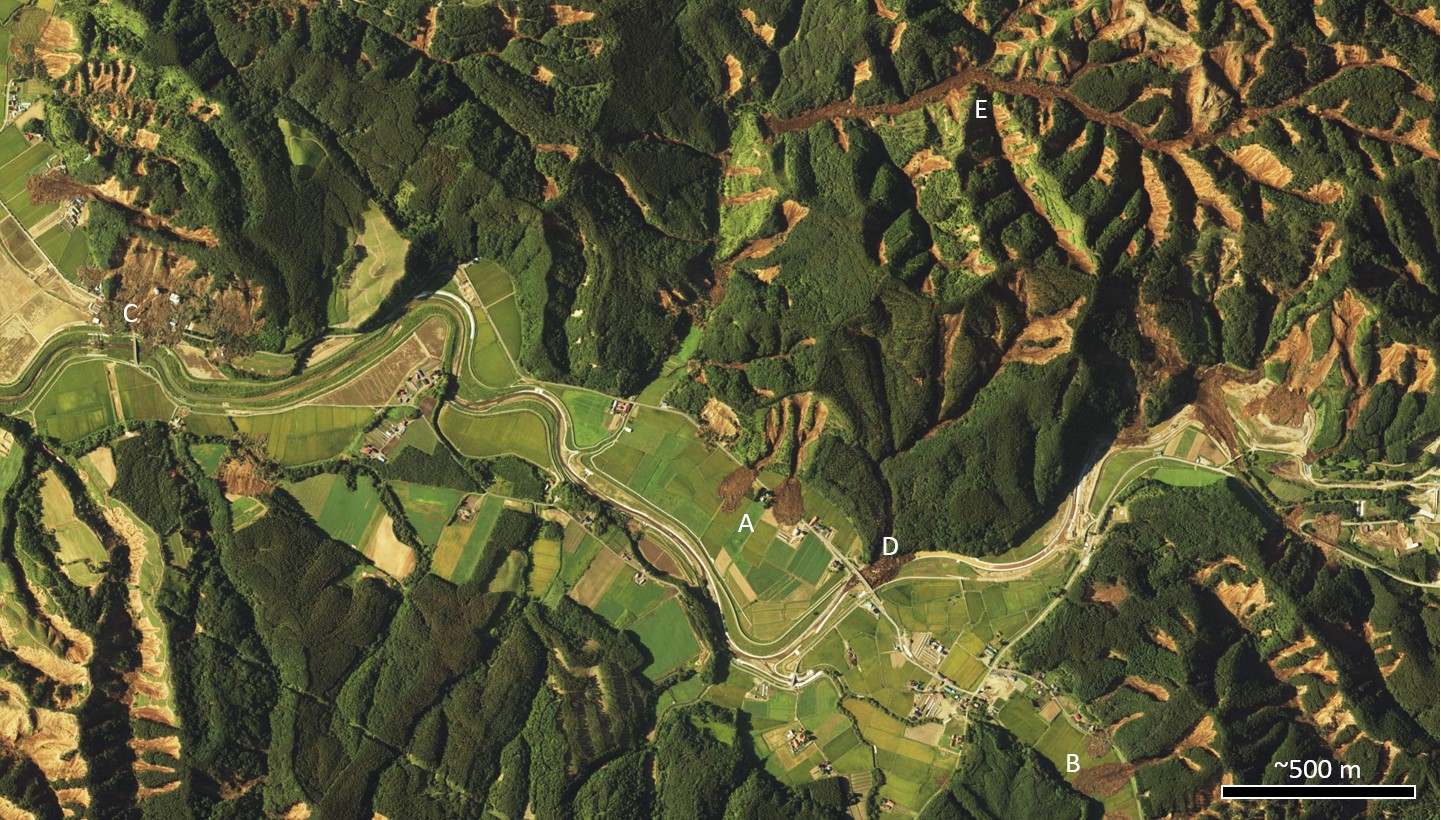
Heavy rainfall leads to flooding, of course, but one of the other consequences is slope failure. Soaking with water from a tropical storm and then seismic shaking led to the occurrence of thousands of slope failures in the Sapporo area of Hokkaido, Japan in September 2018, as shown on Figure 5.1.7 in Section 5.1. The region, which was already wet from summer rain, was further soaked with rain from Typhoon Jebi on September 4th. On September 6th it was shaken by a M6.6 earthquake which triggered over 6000 slumps, mud flows and debris flows in weathered volcanic soils on both steep and moderate slopes. There were 41 deaths related to the slope failures.
Figure 15.3.6 provides a view of a small part of the area affected by the September 2018 slope failures on Hokkaido. Several types of outcomes are evident in this small area, including runout onto farmland (A and B), runout into buildings and a road (C), blockage of a stream (D, in this case the Atsuma River), and a long runout train (about 2 km) from several separate failures along both sides of a narrow valley (E).
While tropical storms and other climate-change related phenomena can lead to extreme precipitation events, climate change can also contribute to intense drought conditions. One example of that is the significant drought that has affected the southwestern region of the US since about 2012, contributing the unprecedented wildfire episodes of recent years, and especially the summer of 2020 (as described in the Chapter 15 Introduction). Another example is the El Niño phenomenon (a.k.a. El Niño Southern Oscillation or ENSO). ENSO varies on a cycle of between 2 and 7 years and leads to extreme weather conditions in many parts of the world. In Australia the El Niño phase brings hot and dry weather, while the opposing La Niña phase typically brings wet conditions (and often serious flooding). Under the hot and dry El Niño conditions there is a high probability of severe wildfires, especially in the eastern part of the country. Interestingly, Australia’s record-breaking fire season of late 2019 to early 2020 took place during an ENSO-neutral period (neither strong La Niña nor strong El Niño), although it was a particularly hot year globally.
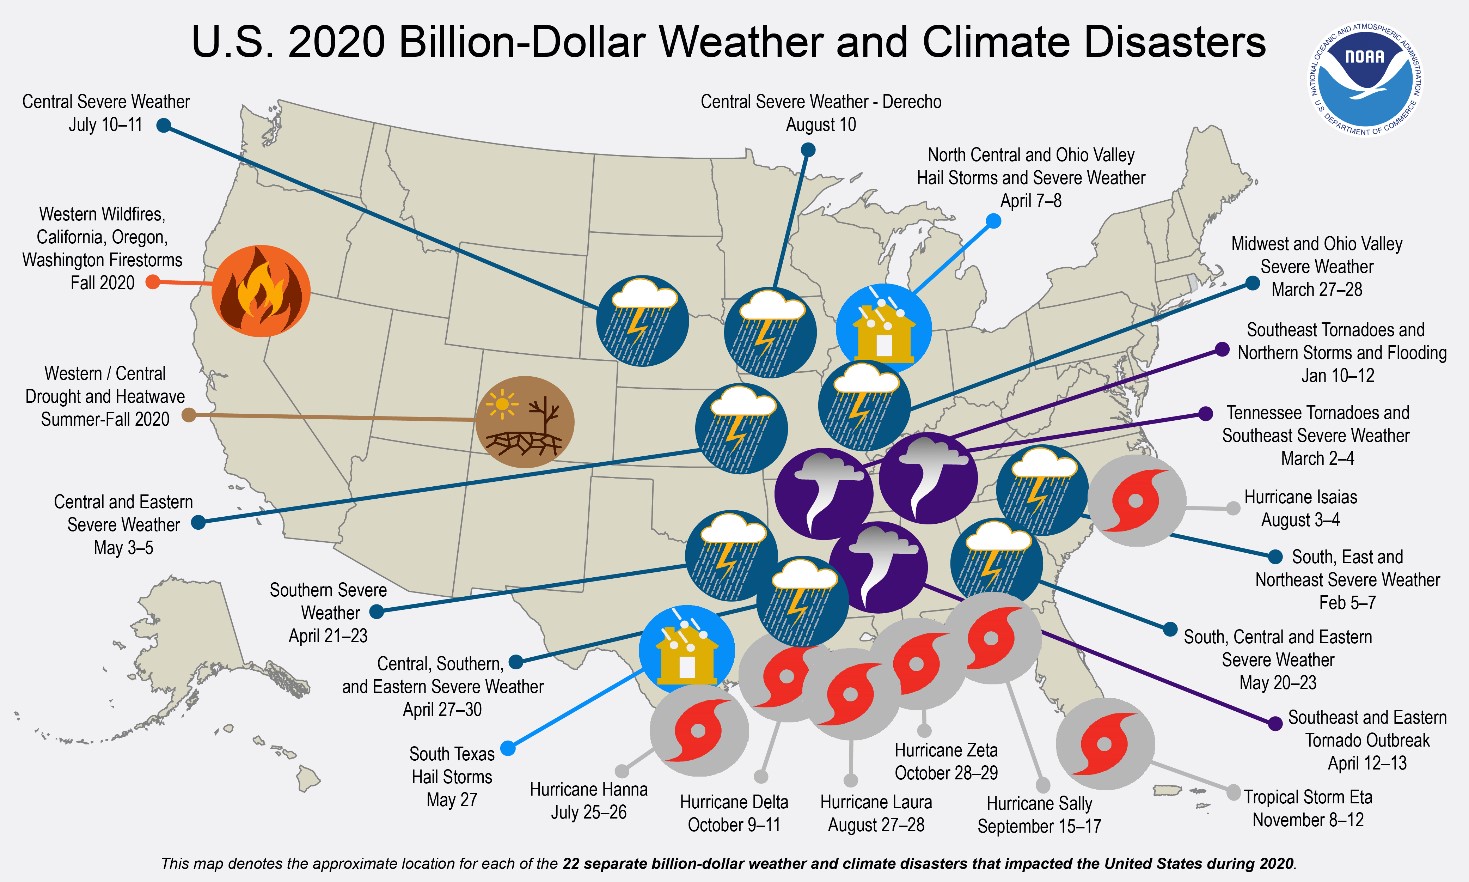
In summary, while the ongoing increase in global temperatures, and the long-term changes to precipitation patterns continue to have geological impacts, shorter-term events like the ENSO cycle and tropical storms, which are becoming more severe because of climate change, will likely punctuate the climate-change narrative with extreme events that each result in billions of dollars of damage. A NOAA summary of damaging weather events in the US during 2020 is provided on Figure 15.3.6.[1] In that year there were 22 billion-dollar-plus weather disasters, with a combined economic cost of $95 billion. The severity of many of these events can be attributed to climate change, and most of these types of events have implications for environmental geology.
Media Attributions
- Figure 15.3.1 Paulette, Rene, Sally, Teddy and Vicky from NOAA, 2020, public domain, via Wikimedia Commons, https://commons.wikimedia.org/wiki/File:Paulette,_Rene,_Sally,_Teddy_and_Vicky_2020-09-14_1550Z.jpg
- Figure 15.3.2 Steven Earle, CC BY 4.0, using public domain data from Atlantic Storm Totals Table, NOAA, https://www.nhc.noaa.gov/climo/images/AtlanticStormTotalsTable.pdf, and from NASA Goddard Institute for Space Studies, https://data.giss.nasa.gov/gistemp/tabledata_v4/GLB.Ts+dSST.txt
- Figure 15.3.3 Photo by NOAA, 2008, public domain image from the National Weather Service, https://www.weather.gov/
- Figure 15.3.4 Rainfall Map from NOAA, public domain, https://www.weather.gov/mob/katrina; modified by Steven Earle, CC BY 4.0, to include tornado locations from a NOAA map via Wikimedia Commons, https://commons.wikimedia.org/wiki/File:Hurricane_Katrina_preliminary_tornado_reports.png
- Figure 15.3.5 Ground Surface in Northern Atsuma Town by Geospatial Information Authority of Japan, 2018, CC BY 4.0, via Wikimedia Commons, https://commons.wikimedia.org/wiki/File:Ground_surface_in_northern_Atsuma_Town_after_2018_earthquake.jpg; annotations added by Steven Earle, 2021, CC BY 4.0
- Figure 15.3.6 Fast Facts: Hurricane Costs by NOAA, 2021, public domain, https://coast.noaa.gov/states/fast-facts/hurricane-costs.html
- US National Oceanographic and Atmospheric Administration (2021). U.S. 2020 Billion-dollar weather and climate disasters [graphic]. In Fast facts: Hurricane costs. https://www.noaa.gov/ ↵