6.3 Measuring Earthquakes
There are two main ways to measure earthquakes. The first of these is an estimate of the energy released, and the value is referred to as magnitude. This is the number that is typically first released by the press when a big earthquake happens. It is often referred to as “Richter magnitude”, but that is a misnomer, and it should be just “magnitude”. There are many ways to measure magnitude—including Charles Richter’s method developed in 1935—but they are all ways to estimate the same number: the amount of energy released.
The other way of assessing the impact of an earthquake is to assess what people felt and how much damage was done. This is known as intensity. Intensity values are assigned to locations, rather than to the earthquake itself, and intensity can vary widely therefore, depending on the proximity to the earth quake and the type of ground underneath.
Earthquake Magnitude
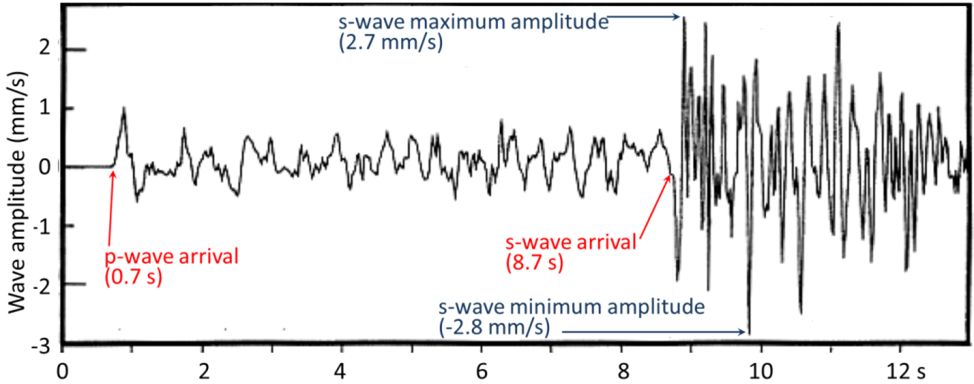
Before we look more closely at magnitude we need to review what we know about body waves, and also look at surface waves. Body waves are of two types, P or primary or compression waves (like the compression of the coils of a spring), and S or secondary or shear waves (like the flick of a rope). An example of P and S seismic records is shown on Figure 6.3.1. The critical parameters for the measurement of Richter magnitude are labelled, including the time interval between the arrival of the P and S waves—which is used to determine the distance from the earthquake to the seismic station, and the amplitude of the S waves—which is used to estimate the magnitude.
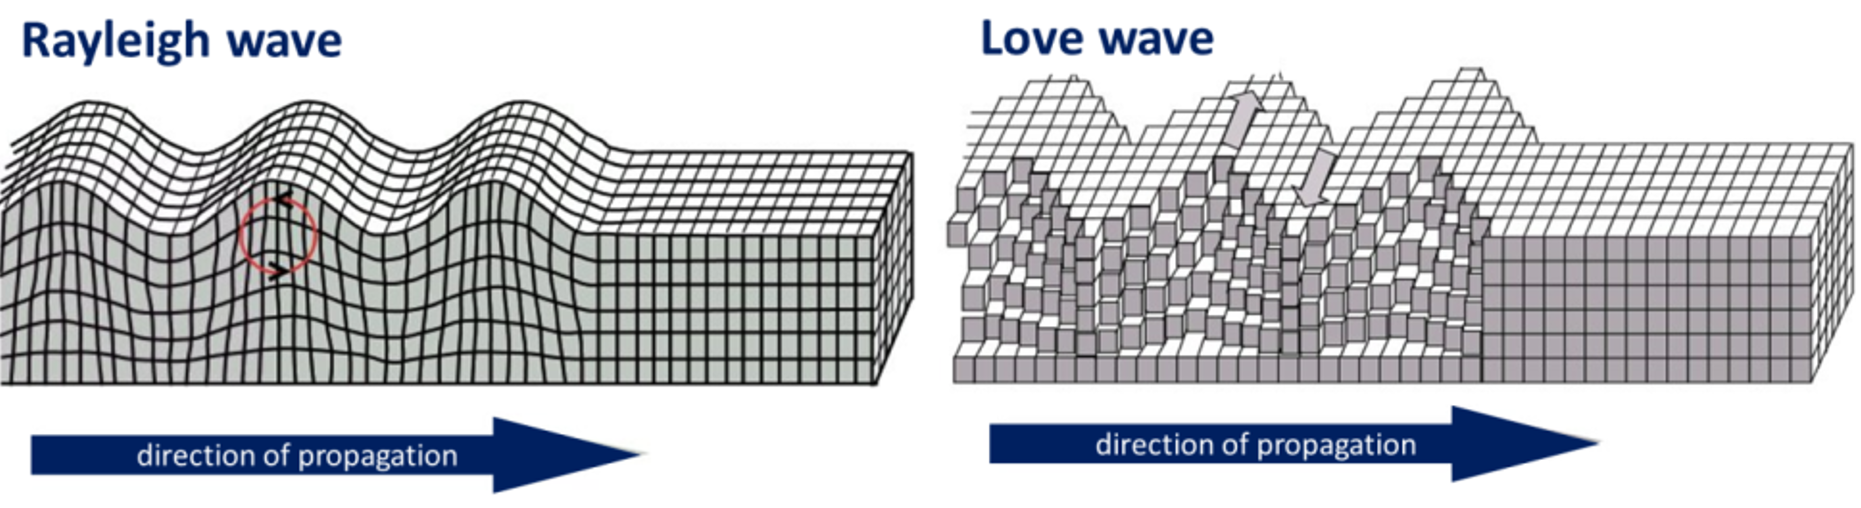
When a body wave (P or S) reaches the Earth’s surface some of its energy is transformed into surface waves, of which there are two main types, as illustrated in Figure 6.3.2. Rayleigh waves are characterized by vertical motion of the ground surface, like waves on water, while Love waves are characterized by horizontal motion. Both Rayleigh and Love waves are about 90% as fast as S waves (so they arrive later at a seismic station). Surface waves typically have greater amplitudes than body waves, and they do more damage.
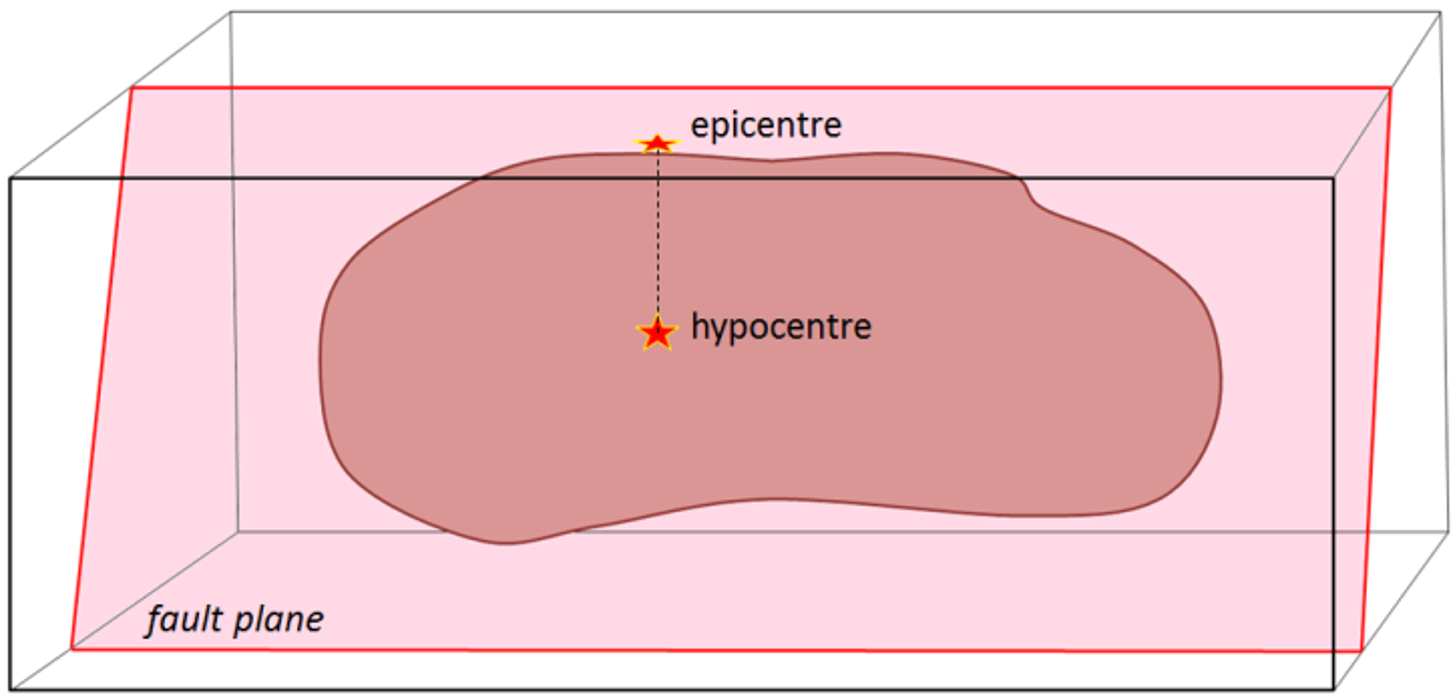
Two other important terms from the perspective of describing earthquakes are hypocentre and epicenter. The hypocentre is the actual location of an individual earthquake shock at depth in the ground, and the epicentre is the point on the land surface directly above the hypocentre (Figure 6.3.4).
A number of methods for estimating magnitude are listed in Table 6.1. Local magnitude (ML) was widely used until late in the 20th century, but moment magnitude (MW) is now more commonly used because it gives more accurate estimates (especially with larger earthquakes) and can be applied to earthquakes at any distance from a seismometer. Surface-wave magnitudes can also be applied to large distant earthquakes.
Because of the increasing size of cities in earthquake-prone areas (e.g., China, Japan, California and Turkey) and the increasing sophistication of infrastructure, it is becoming important to have very rapid warnings and magnitude estimates of earthquakes that have already happened. This can be achieved by using P-wave data because P waves arrive first at seismic stations, in many cases several seconds ahead of the more damaging S waves and surface waves. Operators of electrical grids, pipelines, trains and other infrastructure can use the information to automatically shut systems down so that damage and casualties can be limited.
| Type | Magnitude range | Distance range | Comments |
| Local or Richter (ML) | 2 to 6 | 0 to 400 km | The original magnitude relationship defined in 1935 by Richter and Gutenberg. It is based on the maximum amplitude of S waves recorded on a Wood Anderson torsion seismograph. ML values can be calculated using data from modern instruments. L stands for local because it only applies to earthquakes relatively close to the seismic station. |
| Moment (MW) | > 3.5 | all | Based on the seismic moment of the earthquake, which is equal to the average amount of displacement on the fault times the fault area that slipped. It can also be estimated from seismic data if the seismometer is tuned to detect long-period body waves. Moment magnitude can also be estimated from the size of the earthquake rupture surface and the amount of displacement, as shown in Exercise 6.2. |
| Surface wave (MS) | 5 to 8 | 20° to 180° | A magnitude for distant earthquakes based on the amplitude of surface waves measured at a period near 20 sec. |
| P-wave | 2 to 8 | local | Based on the amplitude of P-waves, this technique is being increasingly used to provide very rapid magnitude estimates so that early warnings can be sent to utility and transportation operators to shut equipment down before the larger (but slower) S waves and surface waves arrive |
Exercise 6.2 Moment Magnitude Estimates from Earthquake Parameters
A moment magnitude calculation tool is available from the BC Campus SOL*R repository at http://solr.bccampus.ca:8001/bcc/file/5ec5dd3f-2da1-4603-807d-035d6a5cf9f0/1/Moment%20Magnitude%20Calculator.html. You can use it to estimate the moment magnitude based on the approximate rupture-zone length, width and displacement values provided in the following table:
| Length (km) | Width (km) | Displacement (m) | Comments | MW? |
| 60 | 15 | 4 | The 1946 Vancouver Island earthquake (see Figure 6.3.4) | _____ |
| 0.4 | 0.2 | 0.5 | The small Vancouver Island earthquake shown on Figure 6.3.1 | _____ |
| 20 | 8 | 4 | The 2001 Nisqually earthquake described in Exercise 6.3 | _____ |
| 1100 | 120 | 10 | The devastating 2004 Indian Ocean earthquake | _____ |
| 30 | 11 | 4 | The deadly 2010 Haiti earthquake | _____ |
The 1989 Loma Prieta Earthquake, illustrated on Figure 6.1.4, had a magnitude of 6.9. Use that diagram to estimate the length and the width (depth) of the rupture surface, and then use the magnitude calculator to find a number for displacement that will give you the correct magnitude.
Exercise answers are provided Appendix 2
The magnitude scale is logarithmic, in fact the amount of energy released by an earthquake of magnitude 4 is 32 times higher than that released by one of magnitude 3, and this ratio applies to all intervals in the scale. If we assign an arbitrary energy level of 1 unit to a magnitude 1 earthquake the energy for quakes up to magnitude 8 will be as shown on the following list:
| Magnitude | 1 | 2 | 3 | 4 | 5 | 6 | 7 | 8 |
| Energy | 1 | 32 | 1024 | 32,768 | 1,048,576 | 33.5 million | 1.1 billion | 34.6 billion |
In any given year when there is a large earthquake on Earth (M 8 or 9) the amount of energy released by that one event will likely exceed the energy released by all smaller events combined.
Earthquake Intensity
The intensity of earthquake shaking at any location is determined by the magnitude of the earthquake and its distance, but also by the type of underlying rock or unconsolidated materials. If buildings are present, the size and type of building are also important.
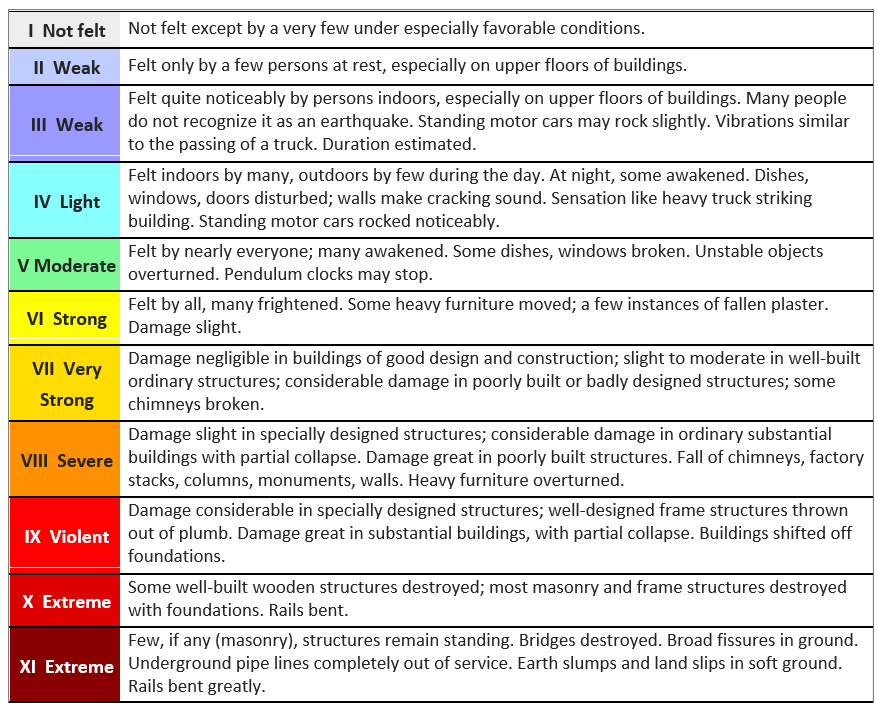
Intensity scales were first used in the late 19th century, and then adapted in the early 20th century by Giuseppe Mercalli and modified later by others to form what we know call the Modified Mercalli Intensity scale (Figure 6.3.5). Intensity estimates are important because they allow us to characterize parts of any region into areas that are especially prone to strong shaking versus those that are not. The key factor in this regard is the nature of the underlying geological materials, and the weaker those are the more likely it is that there will be strong shaking. Areas underlain by strong solid bedrock tend to experience much less shaking that those underlain by unconsolidated river or lake sediments.
An example of this amplifying effect is provided by the 1985 M8 earthquake which struck the Pacific coast Michoacán region of western Mexico, about 350 km southwest of Mexico City. There was relatively little damage in the area around the epicentre, but there was tremendous damage and about 5000 deaths in heavily populated Mexico City. The key reason for this is that Mexico City was built largely on the unconsolidated and water-saturated sediment of former Lake Texcoco. These sediments resonate at a frequency of about 2 seconds, which was similar to the frequency of the body waves that reached the city.[1] For the same reason that a powerful opera singer can break a wine glass by singing the right note, the seismic shaking was amplified by the lake sediments. Survivors of the disaster recounted that the ground in some areas moved up and down by about 20 cm every 2 seconds for over 2 minutes. Damage was greatest to buildings between 5 and 15 stories tall, because they also resonated at around 2 seconds, and amplified the shaking.
Exercise 6.3 Estimating Intensity from Personal Observations
The following observations were made by residents of the Nanaimo BC area during the M6.8 Nisqually earthquake near to Olympia Washington in 2001. Estimate the Mercalli intensities using Figure 6.3.5.
Exercise answers are provided Appendix 2
| Building type | Floor | Shaking felt | Lasted (sec) | Description of motion | Intensity? |
| House | 1 | none | 10 | heard a large rumble lasting not even 10 sec., mirror swayed | ____ |
| House | 2 | moderate | 60 | candles, pictures & CD’s on bookshelf moved, towels fell off racks | ____ |
| House | 1 | none | – | pots hanging over stove moved and crashed together | ____ |
| House | 1 | weak | – | rolling feeling with a sudden stop, picture fell off mantle, chair moved | ____ |
| Apartment | 1 | weak | 10 | sounded like a big truck then everything shook for a short period | ____ |
| House | 1 | moderate | 20-30 | tea-cups rattled but didn’t fall off | ____ |
| Institution | 2 | moderate | 15 | creaking sounds, swaying movement of shelving | ____ |
| House | 1 | moderate | 15-30 | bed banging against the wall with me in it, dog barking aggressively | ____ |
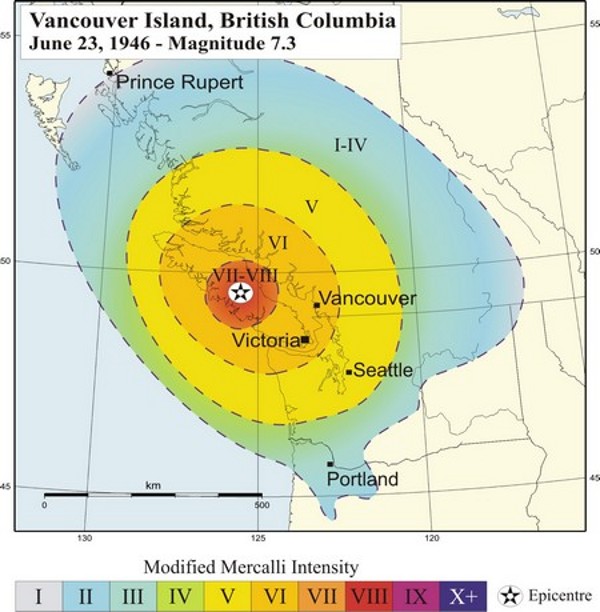
An intensity map for the M7.3 June 1946 Vancouver Island Earthquake is shown on Figure 6.3.5. The intensity was greatest in the central island region where, in some communities, chimneys were damaged on more than 75% of buildings, some roads were made impassable and a major rock slide occurred. The earthquake was felt as far north as Prince Rupert, as far south as Portland Oregon and as far east as the Rockies.
Media Attributions
- Figure 6.3.1 Steven Earle, CC BY 4.0, after a Open Government Licence – Canada image provided by Natural Resources Canada
- Figure 6.3.2 Modified by Steven Earle, from images via Wikipedia: https://en.wikipedia.org/wiki/Rayleigh_wave#/media/File:Rayleigh_wave.jpg, Public domain, and https://en.wikipedia.org/wiki/Love_wave#/media/File:Love_wave.jpg, CC BY 4.0
- Figure 6.3.3 Steven Earle, CC BY 4.0
- Figure 6.3.4 Steven Earle, CC BY 4.0, based on the modified scale by the US Geological Survey (public domain), https://www.usgs.gov/natural-hazards/earthquake-hazards/science/modified-mercalli-intensity-scale?qt-science_center_objects=0#qt-science_center_objects
- Figure 6.3.5 Intensity Map for 1946 M7.3 Vancouver Island Earthquake by Earthquakes Canada, Open Government Licence – Canada http://www.earthquakescanada.nrcan.gc.ca/historic-historique/events/19460623-eng.php
- An earthquake creates seismic waves with a wide range of frequencies. The fast-vibrating shorter wavelength waves get absorbed by strong bedrock because strong rock has a fast natural vibration frequency. The slow-vibrating longer wavelength waves can travel a long way through the solid rocks of the crust (because they don't match its natural vibration frequency and are not absorbed), and these are the waves that reached Mexico City in 1985. Their slow frequencies matched the natural frequency of the sediments underneath the city. ↵