14.1 The Waste Stream
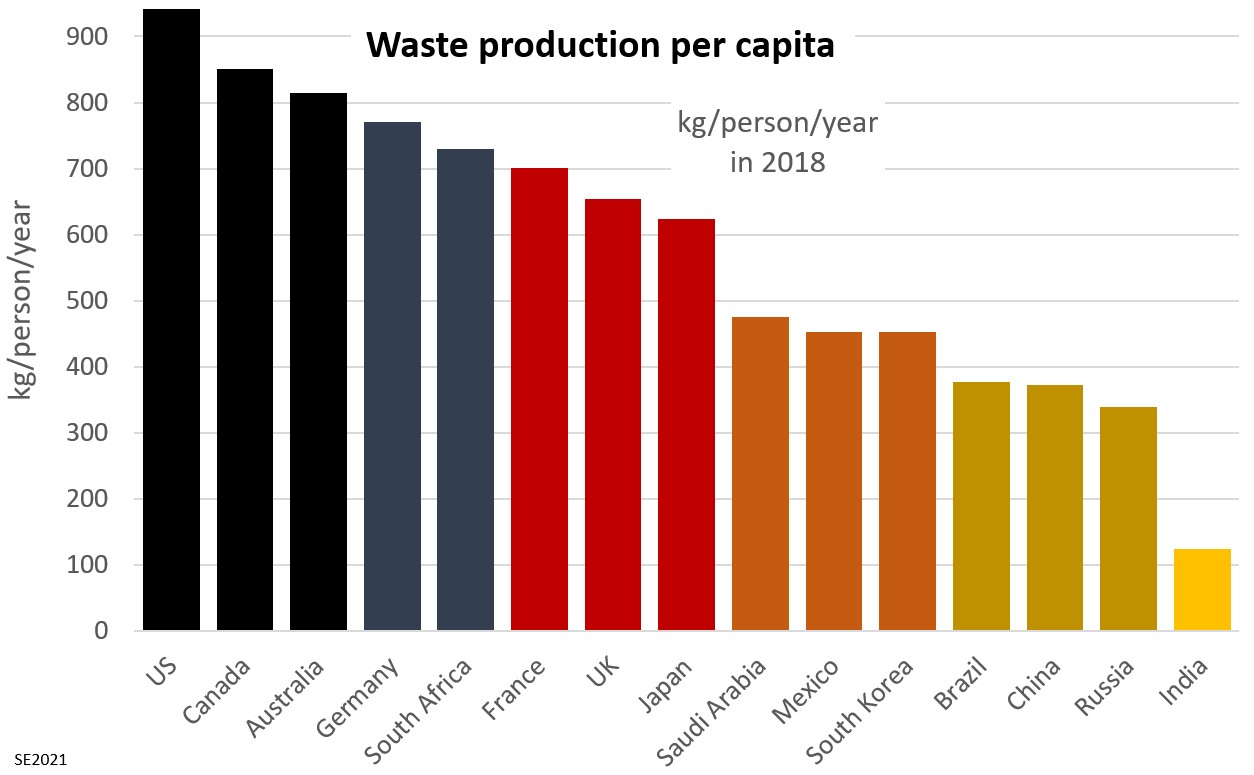
Waste production varies significantly from country to country, and from place to place within a country, both in terms of volume and type. As shown on Figure 14.1.1, Americans and Canadians are the most wasteful people on the planet, followed closely by Australians (and New Zealanders), South Africans and Europeans. Each American produced an average of over 900 kg of waste in 2018, or about 2.5 kg/day. In contrast Indians produced just over 100 kg in 2018 (or about 290 g/day), and it is likely that less of it was plastic, metal or complex electronic waste than is the case in North America.
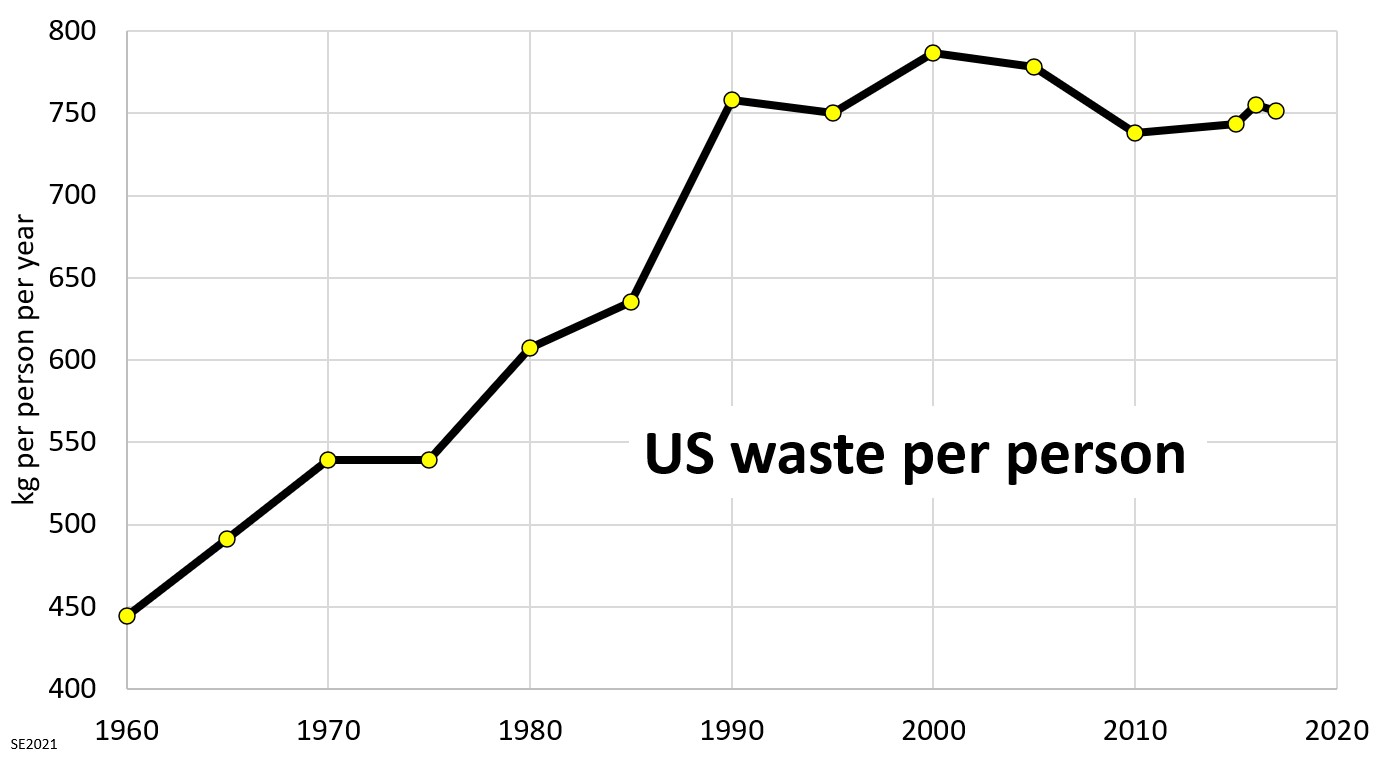
Waste production per person in the United States has increased significantly over the past several decades, but the rate of increase has slowed since 1990, and the trend appears to have been slightly downward since 2000 (Figure 14.1.2). We’ll see later on why that is happening; it’s not because we are consuming less stuff!
Approximately every five years the municipal government of the Victoria region, British Columbia, carries out a painstaking audit of what gets brought to the regional landfill, separating what comes from households, commercial operations, institutions, and building sites and dividing the waste from each stream into about 90 different types, and then carefully weighing each pile of waste. Some of the results from the audit completed in 2016[1] are shown on Figure 14.1.3, which represents household wastes (comprising 38% of the material brought to the landfill). Residents of the Victoria area produce less waste than most Canadians, averaging 357 kg per person per year.
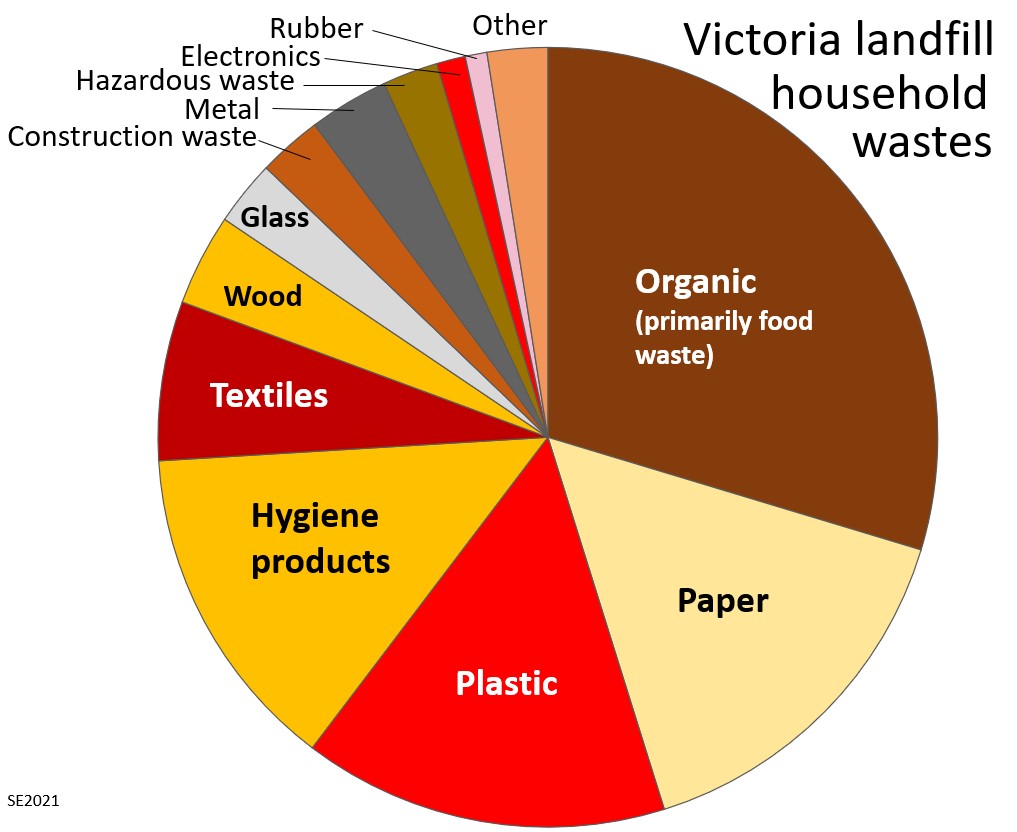
The largest single category for households is organic material, representing 29% of the total, or about 104 kg per person each year, and this is dominated by food and food waste. Of this amount, 43% is described as “avoidable”, meaning that it was perfectly good to eat, and 42% is described as being compostable in a regular backyard composter (e.g., vegetable scraps, tea bags, eggshells, grass cuttings). About 8% of the food waste from residences was described as “donatable”, meaning that it was still in packages, and was still within its “best before” date. Only about 7% of the food waste was classified as being “unavoidable”. Since 2015, organic waste in the Victoria region has been collected in curbside “green bins” and diverted to an off-site industrial composting facility.
The second largest household waste category is paper, representing 15.5% of the total – or 55 kg per person each year. Of this, 42% is recyclable paper, including newsprint, books, card or corrugated cardboard. 40% is described as “compostable soiled paper”, most of which could have been placed in a green bin or a backyard composter. The remaining 18% is described as non-recyclable.
The third household category is plastics, representing 15.1% of the total, or 54 kg/ per person each year. Just over half of this, 53%, is described as being non-recyclable, mostly because facilities don’t exist or are not readily available to consumers, while 46% is recyclable, and 1.3% includes returnable drink containers.
The fourth category is hygiene products—such as disposable diapers, feminine hygiene products and pet litter—which make up 13.7% of the total, or 46 kg per person each year. Almost half of this (48%) is disposable diapers, while 41% is pet litter or animal feces. Very little of the material in this category can be recycled or diverted from the landfill, although some could be avoided with changes in habits (e.g., re-usable diapers).
The fifth household category is textiles, representing 6.6% of the total, or about 24 kg per person each year. Of this, 46% is blankets and sheets, 39% is clothing and 15% is footwear.
The remaining categories, in order are wood, glass (mostly jars), construction waste (mostly carpets and other flooring), metals (mostly cans), hazardous waste (mostly paints and light bulbs), electronics, and rubber.
The Victoria landfill also accepts waste from commercial, industrial and institutional entities, and from construction and demolition companies. The proportions for those two types of sources are summarized on Figure 14.1.4.
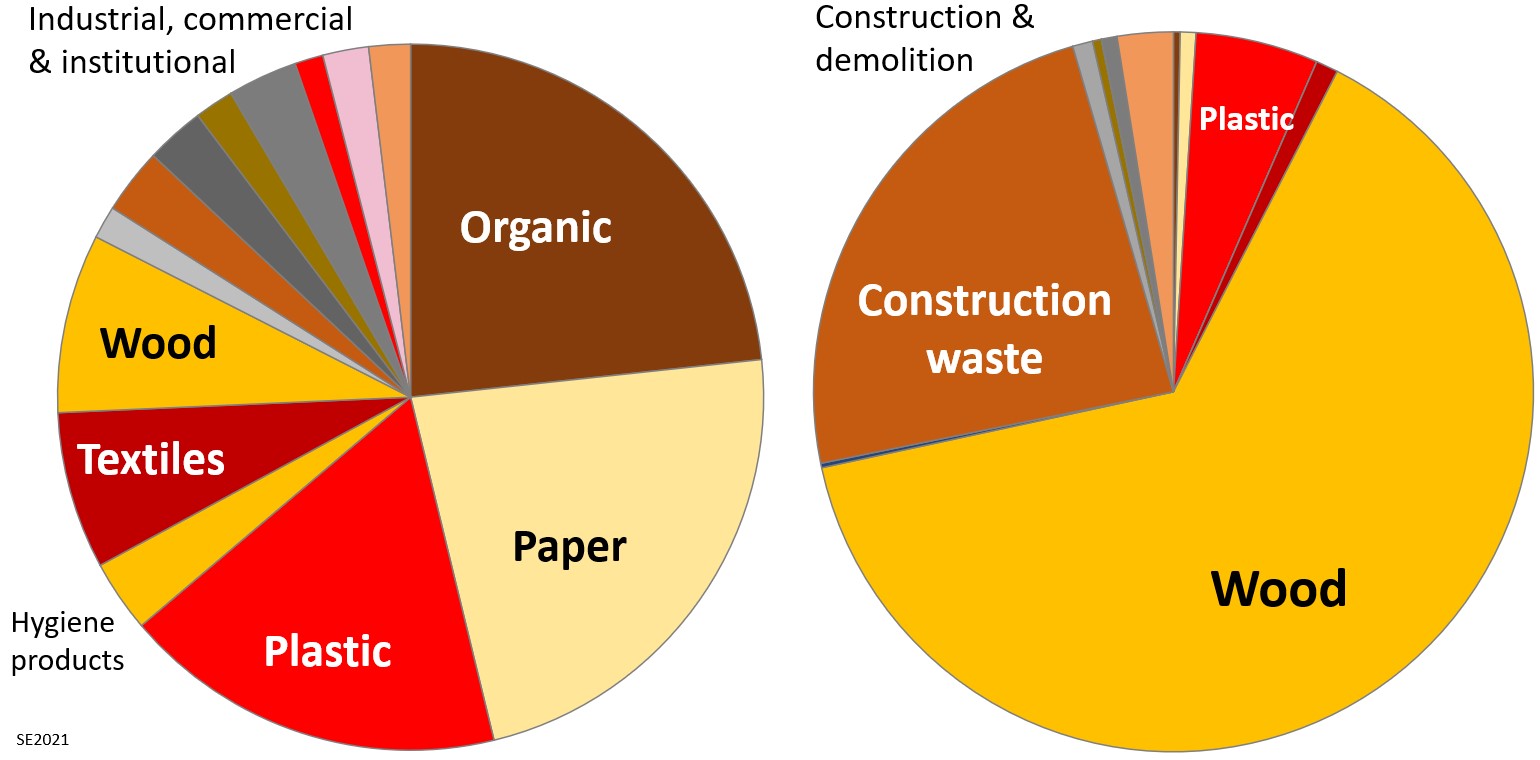
The waste stream from the industrial, commercial and institutional sector (which represents 41% of the landfill’s intake) is not very different than that from the household sector, except that the proportion of food is lower and that of paper, plastic and wood are a little higher. The waste stream from the construction and demolition sector (16% of the total intake) is understandably different, with a great deal more wood waste, and general “construction waste”, which is dominated by shingles and other roofing, and insulation.
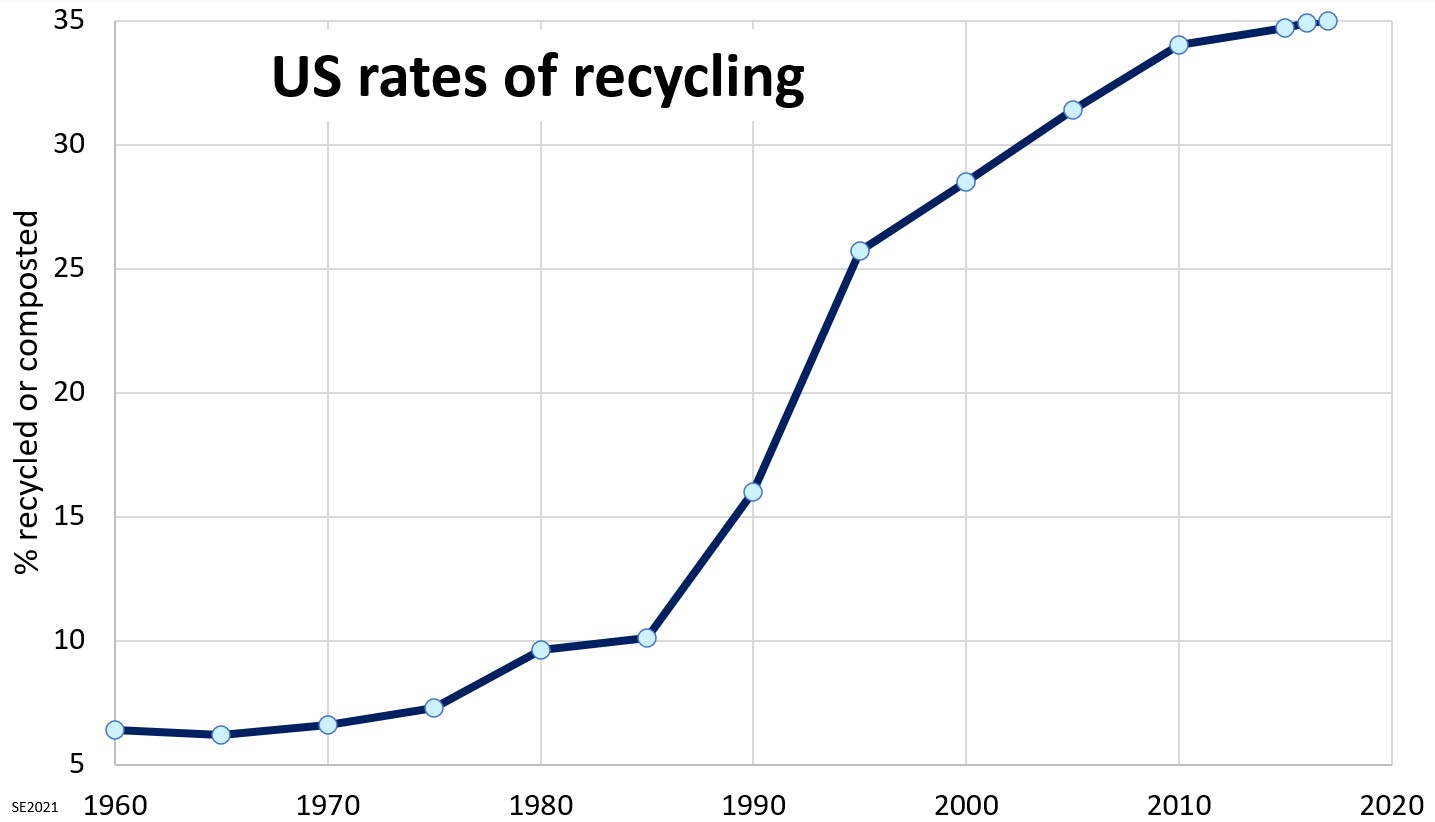
In the 1960s and 1970s only about 7% of waste in the US was recycled or diverted away from the regular waste stream (Figure 14.1.3), but the rate of diversion climbed steeply from 1980 to 2010, which explains why our rate of production of landfill waste (Figure 14.1.2) is levelling off. The rate of diversion appears to have nearly plateaued at around 35%. The important, and rather alarming point here, is that although the amount of waste that is being sent to landfills has plateaued since 1990, the amount of stuff that gets thrown out is still increasing, because more is being sent for recycling. We can take some comfort in the fact that most of the waste sent to recycling is not ending up in landfills.
From the preceding description it is evident that there are several ways to reduce the amount of waste going to our landfills. The first and most obvious is to divert organic matter (through household composting and curbside green-bin programs). If Victoria is a representative example, 29% of household waste can be diverted from landfills in this way. This is happening in Victoria, and in many other cities and towns across Canada, but is not as common in the US. The second is to improve paper recycling. Soiled paper (with food residue for example) can by composted, while most other paper can be recycled and turned into other products. Based on the analysis done in Victoria, it should be possible to divert 80% of paper from the landfill, and that represents 12% of the waste stream. Plastic is the third major category in Victoria, and since just under half of this is recyclable, it represents a potential of about 8% diversion. We could do more to increase that by lobbying our governments to mandate that all plastic products be designed to be 100% recyclable, and also that all beverage containers be given a deposit value. Very little of the material in the hygiene category (14.7%) can be recycled or diverted from the landfill, although some could be avoided with changes in behaviour (e.g., re-usable diapers). Most of the textile items (7%) might have been donatable (reusable), while others might be recyclable in some jurisdictions. Of the remaining items, some are readily recyclable, including wood (4%), glass (3%) and metal (3%).
If we add up the percentages of categories that could be diverted from landfills (based on the information from Victoria), we get a value that is close to 60% (29+12+7+4+3+3 = 58). There are many ways that we could improve on that by changing the way we do things.
Exercise 14.1 The Low-Hanging Fruit
One of the key goals with respect to municipal solid waste is to reduce the volume of material that gets sent to landfills, and especially to reduce the proportion of organic materials that will break down to produce carbon dioxide and methane.
Considering the waste stream in your community (or from your own residence), think about what relatively easy steps could be taken to reduce the amount of organic matter that goes to the landfill.
Exercise answers are provided Appendix 2
Media Attributions
- Figure 14.1.1 Steven Earle, CC BY 4.0, based on Statista data (accessed April 2021), https://www.statista.com/statistics/689809/per-capital-msw-generation-by-country-worldwide/
- Figure 14.1.2 Steven Earle, CC BY 4.0, based on public domain open data from Environmental Protection Agency. (n.d.). Generation Trends. In National overview: Facts and figures on materials, wastes and recycling (accessed April 2021). https://www.epa.gov/facts-and-figures-about-materials-waste-and-recycling/national-overview-facts-and-figures-materials#GenerationTrends
- Figure 14.1.3 Steven Earle, CC BY 4.0, based on data in Tetra Tech (2016)
- Figure 14.1.4 Steven Earle, CC BY 4.0, based on data in Tetra Tech (2016)
- Figure 14.1.5 Steven Earle, CC BY 4.0, based on public domain open data from Environmental Protection Agency. (n.d.). Recycling and composting trends. In National overview: Facts and figures on materials, wastes and recycling. https://www.epa.gov/facts-and-figures-about-materials-waste-and-recycling/national-overview-facts-and-figures-materials#GenerationTrends
- Tetra Tech. (2016). 2016 solid waste stream composition study. Capital Regional District File SWM.SWOP03315. https://www.crd.bc.ca/docs/default-source/recycling-waste-pdf/WasteCompositionStudy2016.pdf?sfvrsn=baab36ca_4 ↵